17. Of Colors and Color Legends
17.1. Built-in color palette tables (CPT)
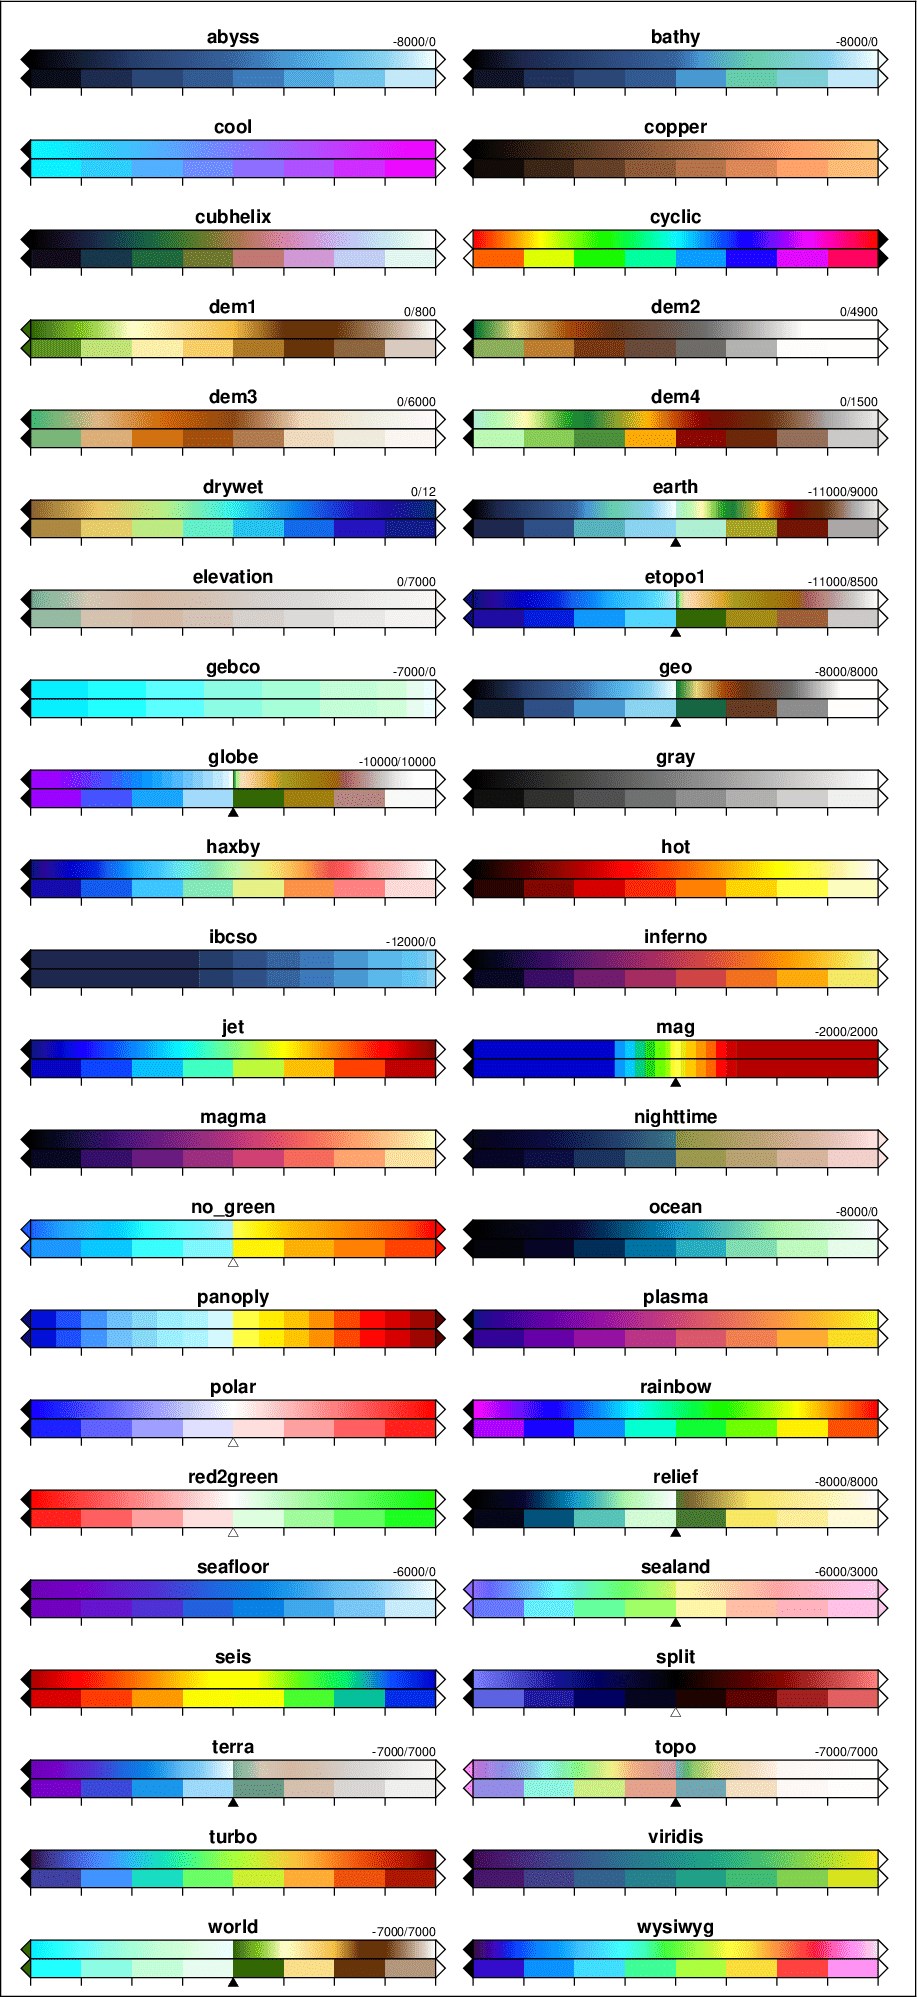
Figures CPTs a, b, c and d show the built-in color palettes, stored in so-called CPTs. The programs makecpt and grd2cpt are used to access these master CPTs and translate/scale them to fit the user’s range of z-values. The top half of the color bars in the Figure shows the original color scale, which can be either discrete or continuous, though some (like globe) are a mix of the two. The bottom half the color bar are built by using makecpt -T-1/1/0.25, thus splitting the color scale into 8 discrete colors. Black and white triangles indicate which tables have hard or soft hinges, respectively. Some CPTs have a default z-range while others are dynamic. Default ranges, if available, are indicated on the top-right of the scales.

The standard 44 CPTs supported by GMT.
Here is the source script for the figure above:
GMT_SHAREDIR=$(gmt --show-sharedir)

cat << EOF > skip.lis
acton
bam
bamako
batlow
batlowK
batlowW
berlin
bilbao
broc
buda
bukavu
cork
davos
devon
fes
grayC
hawaii
imola
lajolla
lapaz
lisbon
nuuk
oleron
oslo
roma
tofino
tokyo
turku
vanimo
vik
srtm
categorical
paired
EOF
sed -e 's/"//g' "${GMT_SOURCE_DIR}"/src/gmt_cpt_masters.h | fgrep -v -f skip.lis | awk '{print $1}' | sort -r > tt.lis

n=$(cat tt.lis | wc -l)
let n2=n/2
dy=0.6
y0=$(gmt math -Q $n2 $dy MUL 0.1 ADD =)

gmt begin GMT_App_M_1a
gmt set GMT_THEME cookbook
gmt set MAP_FRAME_PEN thinner FONT_ANNOT_PRIMARY 8p MAP_TICK_LENGTH_PRIMARY 0.1i MAP_ANNOT_OFFSET_PRIMARY 0.04i
gmt basemap -R0/6.1/0/$y0 -Jx1i -B0

let i=1
y=0.375
y2=0.25
while [ $i -le $n ]
do
	j=$(expr $i + 1)
	left=$(sed -n ${j}p tt.lis)
	right=$(sed -n ${i}p tt.lis)
	gmt makecpt -H -C$left -T-1/1 > tt.left.cpt
	gmt makecpt -H -C$left -T-1/1/0.25 > tt.left2.cpt
	gmt makecpt -H -C$right -T-1/1 > tt.right.cpt
	gmt makecpt -H -C$right -T-1/1/0.25 > tt.right2.cpt
	gmt colorbar -Dx1.55i/${y}i+w2.70i/0.125i+h+jTC+e -Ctt.left.cpt -B0
	gmt colorbar -Dx4.50i/${y}i+w2.70i/0.125i+h+jTC+e -Ctt.right.cpt -B0
	gmt colorbar -Dx1.55i/${y2}i+w2.70i/0.125i+h+jTC+e -Ctt.left2.cpt -Bf0.25
	gmt colorbar -Dx4.50i/${y2}i+w2.70i/0.125i+h+jTC+e -Ctt.right2.cpt -Bf0.25
	gmt text -D0/0.05i -F+f9p,Helvetica-Bold+jBC <<- END
	1.55 $y ${left}
	4.50 $y ${right}
	END
	if [ $(grep -c RANGE ${GMT_SHAREDIR}/cpt/${left}.cpt) -eq 1 ]; then # Plot default range for left CPT
		grep RANGE ${GMT_SHAREDIR}/cpt/${left}.cpt | awk '{printf "2.9 %g %s\n", "'$y'", $4}' | gmt text -F+f6p,Helvetica+jRB -D0/0.025i -N
	fi
	if [ $(grep -c HARD_HINGE ${GMT_SHAREDIR}/cpt/${left}.cpt) -eq 1 ]; then # Plot hard hinge symbol for left CPT
		echo 1.55 $y | gmt plot -St0.2c -Gblack -Wfaint -D0/-0.29i
	elif [ $(grep -c SOFT_HINGE ${GMT_SHAREDIR}/cpt/${left}.cpt) -eq 1 ]; then # Plot soft hinge symbol for left CPT
		echo 1.55 $y | gmt plot -St0.2c -Gwhite -Wfaint -D0/-0.29i
	fi
	if [ $(grep -c RANGE ${GMT_SHAREDIR}/cpt/${right}.cpt) -eq 1 ]; then # Plot default range for left CPT
		grep RANGE ${GMT_SHAREDIR}/cpt/${right}.cpt | awk '{printf "5.85 %g %s\n", "'$y'", $4}' | gmt text -F+f6p,Helvetica+jRB -D0/0.025i -N
	fi
	if [ $(grep -c HARD_HINGE ${GMT_SHAREDIR}/cpt/${right}.cpt) -eq 1 ]; then # Plot hard hinge symbol for right CPT
		echo 4.50 $y | gmt plot -St0.2c -Gblack -Wfaint -D0/-0.29i
	elif [ $(grep -c SOFT_HINGE ${GMT_SHAREDIR}/cpt/${right}.cpt) -eq 1 ]; then # Plot soft hinge symbol for right CPT
		echo 4.50 $y | gmt plot -St0.2c -Gwhite -Wfaint -D0/-0.29i
	fi
	i=$(expr $i + 2)
	y=$(gmt math -Q $y $dy ADD =)
	y2=$(gmt math -Q $y2 $dy ADD =)
done
rm -f tt.* skip.lis
gmt end show

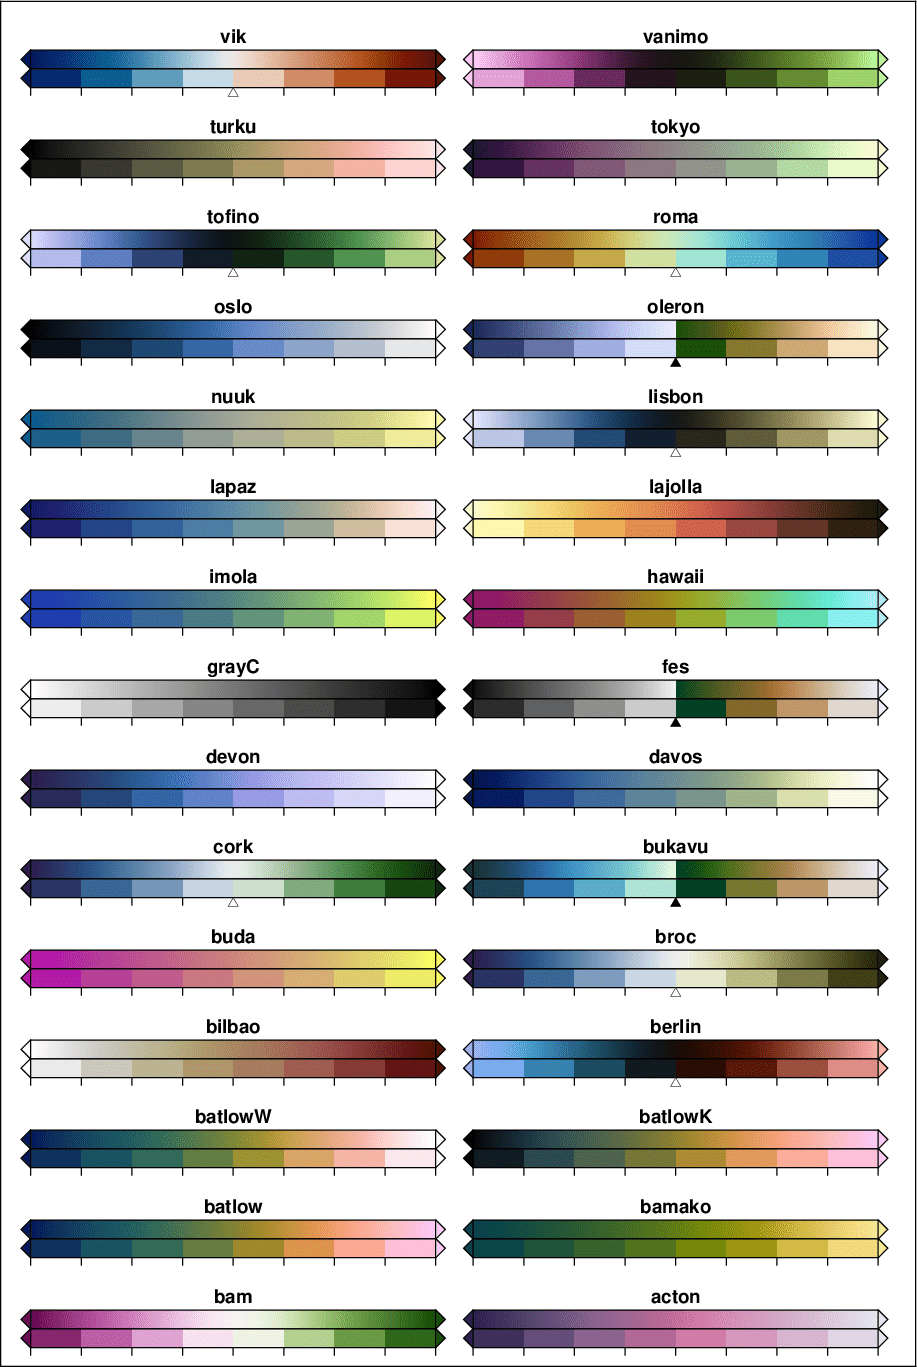
The 30 scientific color maps by Fabio Crameri supported by GMT.
Here is the source script for the figure above:
GMT_SHAREDIR=$(gmt --show-sharedir)

cat << EOF > tt.lis
acton
bam
bamako
batlow
batlowK
batlowW
berlin
bilbao
broc
buda
bukavu
cork
davos
devon
fes
grayC
hawaii
imola
lajolla
lapaz
lisbon
nuuk
oleron
oslo
roma
tofino
tokyo
turku
vanimo
vik
EOF

n=$(cat tt.lis | wc -l)
let n2=n/2
let n2=n
dy=0.6
y0=$(gmt math -Q $n2 $dy MUL 0.5 MUL 0.1 ADD =)

gmt begin GMT_App_M_1b
gmt set GMT_THEME cookbook
gmt set MAP_FRAME_PEN thinner FONT_ANNOT_PRIMARY 8p MAP_TICK_LENGTH_PRIMARY 0.1i MAP_ANNOT_OFFSET_PRIMARY 0.04i
gmt basemap -R0/6.1/0/$y0 -Jx1i -B0

i=1
y=0.375
y2=0.25
while [ $i -le $n2 ]
do
	j=$(expr $i + 1)
	left=$(sed -n ${j}p tt.lis)
	right=$(sed -n ${i}p tt.lis)
	gmt makecpt -H -C$left -T-1/1 > tt.left.cpt
	gmt makecpt -H -C$left -T-1/1/0.25 > tt.left2.cpt
	gmt makecpt -H -C$right -T-1/1 > tt.right.cpt
	gmt makecpt -H -C$right -T-1/1/0.25 > tt.right2.cpt
	gmt colorbar -Dx1.55i/${y}i+w2.70i/0.125i+h+jTC+e -Ctt.left.cpt -B0
	gmt colorbar -Dx4.50i/${y}i+w2.70i/0.125i+h+jTC+e -Ctt.right.cpt -B0
	gmt colorbar -Dx1.55i/${y2}i+w2.70i/0.125i+h+jTC+e -Ctt.left2.cpt -Bf0.25
	gmt colorbar -Dx4.50i/${y2}i+w2.70i/0.125i+h+jTC+e -Ctt.right2.cpt -Bf0.25
	gmt text -D0/0.05i -F+f9p,Helvetica-Bold+jBC <<- END
	1.55 $y ${left}
	4.50 $y ${right}
	END
	if [ $(grep -c HARD_HINGE ${GMT_SHAREDIR}/cpt/${left}.cpt) -eq 1 ]; then # Plot hard hinge symbol for left CPT
		echo 1.55 $y | gmt plot -St0.2c -Gblack -Wfaint -D0/-0.29i
	elif [ $(grep -c SOFT_HINGE ${GMT_SHAREDIR}/cpt/${left}.cpt) -eq 1 ]; then # Plot soft hinge symbol for left CPT
		echo 1.55 $y | gmt plot -St0.2c -Gwhite -Wfaint -D0/-0.29i
	fi
	if [ $(grep -c HARD_HINGE ${GMT_SHAREDIR}/cpt/${right}.cpt) -eq 1 ]; then # Plot hard hinge symbol for right CPT
		echo 4.50 $y | gmt plot -St0.2c -Gblack -Wfaint -D0/-0.29i
	elif [ $(grep -c SOFT_HINGE ${GMT_SHAREDIR}/cpt/${right}.cpt) -eq 1 ]; then # Plot soft hinge symbol for right CPT
		echo 4.50 $y | gmt plot -St0.2c -Gwhite -Wfaint -D0/-0.29i
	fi
	i=$(expr $i + 2)
	y=$(gmt math -Q $y $dy ADD =)
	y2=$(gmt math -Q $y2 $dy ADD =)
done
rm -f tt.*
gmt end show

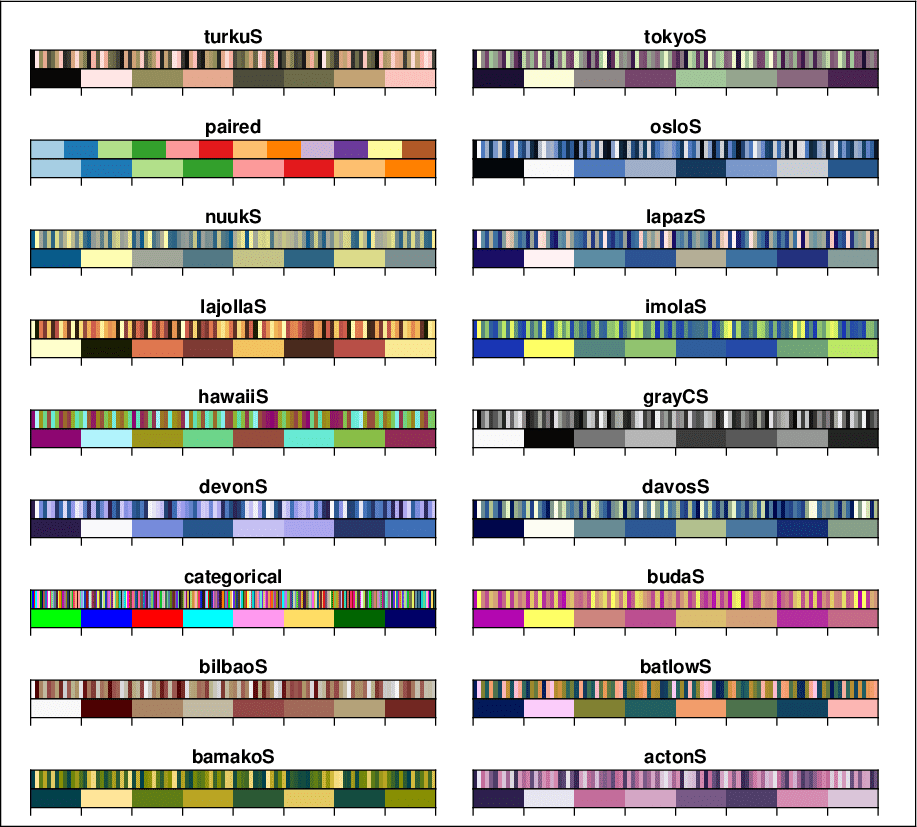
The 18 categorical CPTs (those ending in “S” are the categorical scientific color maps by Fabio Crameri) supported by GMT.
Here is the source script for the figure above:
GMT_SHAREDIR=$(gmt --show-sharedir)

cat << EOF > tt.lis
actonS
bamakoS
batlowS
bilbaoS
budaS
categorical
davosS
devonS
grayCS
hawaiiS
imolaS
lajollaS
lapazS
nuukS
osloS
paired
tokyoS
turkuS
EOF

n=$(cat tt.lis | wc -l)
let n2=n/2
let n2=n
dy=0.6
y0=$(gmt math -Q $n2 $dy MUL 0.5 MUL 0.1 ADD =)

gmt begin GMT_App_M_1c
gmt set GMT_THEME cookbook
gmt set MAP_FRAME_PEN thinner FONT_ANNOT_PRIMARY 8p MAP_TICK_LENGTH_PRIMARY 0.1i MAP_ANNOT_OFFSET_PRIMARY 0.04i
gmt basemap -R0/6.1/0/$y0 -Jx1i -B0

i=1
y=0.375
y2=0.25
while [ $i -le $n2 ]
do
	j=$(expr $i + 1)
	left=$(sed -n ${j}p tt.lis)
	right=$(sed -n ${i}p tt.lis)
	gmt makecpt -H -C$left > tt.left.cpt
	gmt makecpt -H -C$left -T-1/1/0.25 > tt.left2.cpt
	gmt makecpt -H -C$right > tt.right.cpt
	gmt makecpt -H -C$right -T-1/1/0.25 > tt.right2.cpt
	gmt colorbar -Dx1.55i/${y}i+w2.70i/0.125i+h+jTC -Ctt.left.cpt -B0
	gmt colorbar -Dx4.50i/${y}i+w2.70i/0.125i+h+jTC -Ctt.right.cpt -B0
	gmt colorbar -Dx1.55i/${y2}i+w2.70i/0.125i+h+jTC -Ctt.left2.cpt -Bf0.25
	gmt colorbar -Dx4.50i/${y2}i+w2.70i/0.125i+h+jTC -Ctt.right2.cpt -Bf0.25
	gmt text -D0/0.05i -F+f9p,Helvetica-Bold+jBC <<- END
	1.55 $y ${left}
	4.50 $y ${right}
	END
	if [ $(grep -c HARD_HINGE ${GMT_SHAREDIR}/cpt/${left}.cpt) -eq 1 ]; then # Plot hard hinge symbol for left CPT
		echo 1.55 $y | gmt plot -St0.2c -Gblack -Wfaint -D0/-0.29i
	elif [ $(grep -c SOFT_HINGE ${GMT_SHAREDIR}/cpt/${left}.cpt) -eq 1 ]; then # Plot soft hinge symbol for left CPT
		echo 1.55 $y | gmt plot -St0.2c -Gwhite -Wfaint -D0/-0.29i
	fi
	if [ $(grep -c HARD_HINGE ${GMT_SHAREDIR}/cpt/${right}.cpt) -eq 1 ]; then # Plot hard hinge symbol for right CPT
		echo 4.50 $y | gmt plot -St0.2c -Gblack -Wfaint -D0/-0.29i
	elif [ $(grep -c SOFT_HINGE ${GMT_SHAREDIR}/cpt/${right}.cpt) -eq 1 ]; then # Plot soft hinge symbol for right CPT
		echo 4.50 $y | gmt plot -St0.2c -Gwhite -Wfaint -D0/-0.29i
	fi
	i=$(expr $i + 2)
	y=$(gmt math -Q $y $dy ADD =)
	y2=$(gmt math -Q $y2 $dy ADD =)
done
rm -f tt.*
gmt end show

The 5 cyclic scientific color maps by Fabio Crameri supported by GMT. Note: Any GMT CPT can be made cyclic by running makecpt with the -Ww option (wrapped = cyclic).
Here is the source script for the figure above:
GMT_SHAREDIR=$(gmt --show-sharedir)

cat << EOF > tt.lis
bamO
brocO
corkO
romaO
vikO
EOF

n=$(cat tt.lis | wc -l)
let n2=n/2
let n2=n
dy=0.6
y0=$(gmt math -Q $n2 $dy MUL 0.5 MUL 0.25 ADD =)

gmt begin GMT_App_M_1d
gmt set GMT_THEME cookbook
gmt set MAP_FRAME_PEN thinner FONT_ANNOT_PRIMARY 8p MAP_TICK_LENGTH_PRIMARY 0.1i MAP_ANNOT_OFFSET_PRIMARY 0.04i
gmt basemap -R0/6.1/0/$y0 -Jx1i -B0

i=1
y=0.375
y2=0.25
while [ $i -le $n2 ]
do
	j=$(expr $i + 1)
	left=$(sed -n ${j}p tt.lis)
	right=$(sed -n ${i}p tt.lis)
	if [ -n "$left" ]; then
	  gmt makecpt -H -C$left -T-1/1 > tt.left.cpt
	  gmt makecpt -H -C$left -T-1/1/0.25 > tt.left2.cpt
	fi
	gmt makecpt -H -C$right -T-1/1 > tt.right.cpt
	gmt makecpt -H -C$right -T-1/1/0.25 > tt.right2.cpt
	if [ -n "$left" ]; then
	  gmt colorbar -Dx1.55i/${y}i+w2.70i/0.125i+h+jTC -Ctt.left.cpt -B0
	  gmt colorbar -Dx1.55i/${y2}i+w2.70i/0.125i+h+jTC -Ctt.left2.cpt -Bf0.25
		echo 1.55 $y ${left} | gmt text -D0/0.05i -F+f9p,Helvetica-Bold+jBC
	fi
	if [ ${i} == ${n2} ] && [ $((i % 2)) != 0 ]; then
		x=3.05
	else
		x=4.50
	fi
	gmt colorbar -Dx${x}i/${y}i+w2.70i/0.125i+h+jTC -Ctt.right.cpt -B0
	gmt colorbar -Dx${x}i/${y2}i+w2.70i/0.125i+h+jTC -Ctt.right2.cpt -Bf0.25
	echo ${x} $y ${right} | gmt text -D0/0.05i -F+f9p,Helvetica-Bold+jBC
	i=$(expr $i + 2)
	y=$(gmt math -Q $y $dy ADD =)
	y2=$(gmt math -Q $y2 $dy ADD =)
done
rm -f tt.*
gmt end show
For additional color tables, visit cpt-city and Scientific Colour-Maps.
17.2. Labeled and non-equidistant color legends
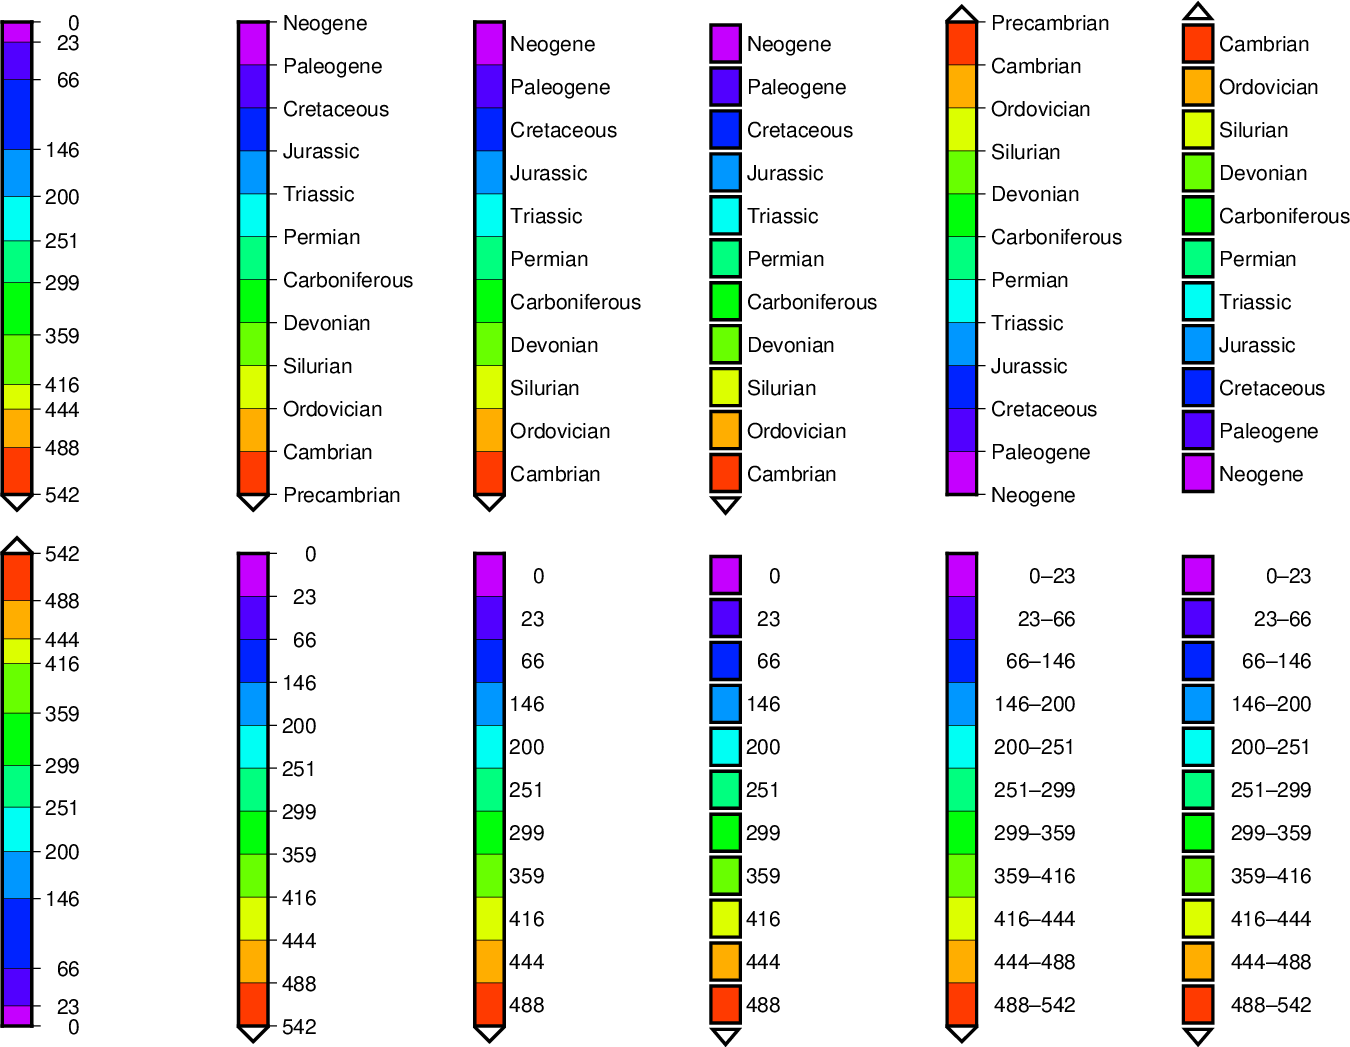
The use of color legends has already been introduced in Examples 2, 16, and 17. Things become a bit more complicated when you want to label the legend with names for certain intervals (like geological time periods in the example below). To accomplish that, one should add a semi-colon and the label name at the end of a line in the CPT and add the -L option to the colorbar command that draws the color legend. This option also makes all intervals in the legend of equal length, even it the numerical values are not equally spaced.
Normally, the name labels are plotted at the lower end of the intervals. But by adding a gap amount (even when zero) to the -L option, they are centered. The example below also shows how to annotate ranges using -Li (in which case no name labels should appear in the CPT), and how to switch the color bar around (by using a negative length).
Note: If the last slice should have both lower and upper custom labels then you must supply two semicolon-separated labels and set the annotation code to B.
Here is the source script for the figure above:
gmt begin GMT_App_M_2
gmt set GMT_THEME cookbook
gmt set FONT_ANNOT_PRIMARY 10p PROJ_LENGTH_UNIT cm PS_MEDIA 11ix8.5i


cat > ages.cpt <<END
0	197	0	255	23	197	0	255	;Neogene
23	81	0	255	66	81	0	255	;Paleogene
66	0	35	255	146	0	35	255	;Cretaceous
146	0	151	255	200	0	151	255	;Jurassic
200	0	255	244	251	0	255	244	;Triassic
251	0	255	127	299	0	255	127	;Permian
299	0	255	11	359	0	255	11	;Carboniferous
359	104	255	0	416	104	255	0	;Devonian
416	220	255	0	444	220	255	0	;Silurian
444	255	174	0	488	255	174	0	;Ordovician
488	255	58	0	542	255	58	0	;Cambrian;Precambrian
B	black
F	white
END

gmt colorbar -Cages.cpt  -Dx00/13+w-8/0.5+jML+ef
gmt colorbar -Cages.cpt  -Dx04/13+w-8/0.5+jML+ef -L
gmt colorbar -Cages.cpt  -Dx08/13+w-8/0.5+jML+ef -L0.0
gmt colorbar -Cages.cpt  -Dx12/13+w-8/0.5+jML+ef -L0.1
gmt colorbar -Cages.cpt  -Dx16/13+w08/0.5+jML+ef -L
gmt colorbar -Cages.cpt  -Dx20/13+w08/0.5+jML+ef -L0.1

sed 's/;.*$//' ages.cpt > years.cpt
gmt colorbar -Cyears.cpt -Dx00/04+w08/0.5+jML+ef
gmt colorbar -Cyears.cpt -Dx04/04+w-8/0.5+jML+ef -L
gmt colorbar -Cyears.cpt -Dx08/04+w-8/0.5+jML+ef -L0.0
gmt colorbar -Cyears.cpt -Dx12/04+w-8/0.5+jML+ef -L0.1
gmt colorbar -Cyears.cpt -Dx16/04+w-8/0.5+jML+ef -Li
gmt colorbar -Cyears.cpt -Dx20/04+w-8/0.5+jML+ef -Li0.1
gmt end show
