colorbar
Plot gray scale or color scale bar
Synopsis
gmt colorbar [ -B[p|s]parameters ] [ -Ccpt ] [ -Drefpoint ] [ -Fpanel ] [ -Gzlo/zhi ] [ -I[max_intens|low_i/high_i] ] [ -Jparameters ] [ -Jz|Zparameters ] [ -L[i][gap] ] [ -M ] [ -N[p|dpi ]] [ -Q ] [ -Rregion ] [ -S[+aangle][+c|n][+s][+xlabel][+yunit] ] [ -U[stamp] ] [ -V[level] ] [ -Wscale ] [ -X[a|c|f|r][xshift] ] [ -Y[a|c|f|r][yshift] ] [ -Zzfile ] [ -pflags ] [ -ttransp ] [ --PAR=value ]
Note: No space is allowed between the option flag and the associated arguments.
Description
Plots gray scales or color scales on maps. Both horizontal and vertical scales are supported. For color palette tables (CPTs) with gradational colors (i.e., the lower and upper boundary of an interval have different colors) we will interpolate to give a continuous scale. Variations in intensity due to shading/illumination may be displayed by setting the option -I. Colors may be spaced according to a linear scale, all be equal size, or by providing a file with individual tile widths. The font used for the annotations along the scale and optional units is specified by FONT_ANNOT_PRIMARY. If a label is requested, it is plotted with FONT_LABEL. For a full overview of CPTs, see the Cookbook section on Color palette tables.
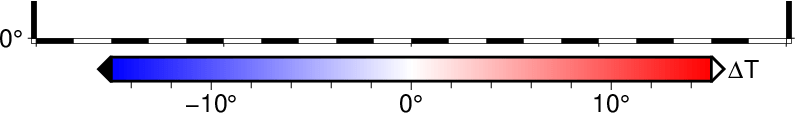
Example of a horizontal colorbar placed below a geographic map.
Required Arguments
None.
Optional Arguments
- -B[p|s]parameters
Set annotation, tick, and gridline interval for the colorbar. The x-axis label will plot beneath a horizontal bar (or vertically to the right of a vertical bar), except when using the +m modifier of the -D option. As an option, use the y-axis label to plot the data unit to the right of a horizontal bar (and above a vertical bar). If -B is omitted, or no annotation intervals are provided (classic mode only), the default is to annotate every color level based on the numerical entries in the CPT (which may be overridden by ULB flags in the CPT). The exception to this rule is for CPT files that were scaled to fit the range of a grid exactly and thus have arbitrary color levels; these will trigger an automatic -Baf setting. To specify custom text annotations for intervals, you must append ;annotation to each z-slice in the CPT. For standard -B operations, (See full description) (See cookbook information).
- -C[cpt]
cpt is the CPT to be used. If no cpt is appended or no -C is given then we use the current CPT (modern mode only). In classic mode, if no -C is given then we read stdin. By default all color changes are annotated. To use a subset, add an extra column to the CPT with a L, U, or B to annotate Lower, Upper, or Both color segment boundaries (but see -B). Like grdview, we can understand pattern specifications in the CPT. For CPTs where the z range is in meters, it may be useful to change to another unit when plotting. To do so, append +Uunit to the file name. Likewise, if the CPT uses another unit than meter and you wish to plot the CPT versus meters, append +uunit. If a GMT master dynamic CPT is given instead then its z-range will be set to its default range (if it has one) before plotting.
- -D[g|j|J|n|x]refpoint[+wlength[/width]][+e[b|f][length]][+h|v][+jjustify][+m[a|c|l|u]][+n[txt]][+odx[/dy]]
Defines the reference point on the map for the color scale using one of four coordinate systems:
Append glon/lat for map coordinates. Requires both -R and -J to be set.
Append jcode or Jcode for setting the refpoint via a 2-char justification code that refers to the (invisible) projected map bounding box. Requires both -R and -J to be set.
Append nxn/yn for normalized bounding box coordinates (0-1). Requires both -R and -J to be set.
Append xx/y for plot coordinates (append cm, inch, or ppoint).
For -Dj or -DJ with codes TC, BC, ML, MR (i.e., centered on one of the map sides) we pre-calculate all further settings. Specifically, the length is set to 80% of the map side, horizontal or vertical depends on the side, the offset is MAP_LABEL_OFFSET for Dj with an extra offset MAP_FRAME_WIDTH for DJ, and annotations are placed on the side of the scale facing away from the map frame. However, you can override any of these with these modifiers: Append +w followed by the length and width of the color bar. If width is not specified then it is set to 4% of the given length. Give a negative length to reverse the scale bar. Append +h to get a horizontal scale [Default is vertical (+v)]. By default, the anchor point on the scale is assumed to be the bottom left corner (BL), but this can be changed by appending +j followed by a 2-char justification code justify (see text). Note: If -Dj is used then justify defaults to the same as refpoint, if -DJ is used then justify defaults to the mirror opposite of refpoint. Consequently, -DJ is used to place a scale outside the map frame while -Dj is used to place it inside the frame. Add sidebar triangles for back- and/or foreground colors with +e. Append f (foreground) or b (background) for only one sidebar triangle [Default gives both]. Optionally, append triangle height [Default is half the barwidth]. Move text to opposite side with +m[a|c|l|u]. Horizontal scale bars: Move annotations and labels above the scale bar [Default is below]; the unit remains on the left. Vertical scale bars: Move annotations and labels to the left of the scale bar [Default is to the right]; the unit remains below. Append one or more of a, l or u to control which of the annotations, label, and unit that will be moved to the opposite side. Append c if you want to print a vertical label as a column of characters (does not work with special characters). Append +n to plot a rectangle with the NaN color at the start of the bar, append text to change label from NaN. If not given, the default argument is JBC (Place color bar centered beneath current plot).
- -F[+cclearances][+gfill][+i[[gap/]pen]][+p[pen]][+r[radius]][+s[[dx/dy/][shade]]]
Without further options, draws a rectangular border around the colorbar using MAP_FRAME_PEN. The following modifiers can be appended to -F, with additional explanation and examples provided in the The background panel cookbook section:
+cclearance where clearance is either gap, xgap/ygap, or lgap/rgap/bgap/tgap and gap gives a uniform clearance, xgap/ygap gives separate clearances in the x- and y- directions, and lgap/rgap/bgap/tgap gives individual clearances between the map embellishment and the border for each side.
+gfill to fill the box with a color specified by fill [default is no fill].
+i[[gap/]pen] to draw a secondary, inner border as well. Optionally, specify the gap between the inner and outer border and the pen for the inner border [default is a uniform gap between borders of 2p and the MAP_DEFAULT_PEN].
+ppen to specify different pen attributes.
+r[radius] to draw rounded rectangular borders instead with a corner radius set by radius (append units) [defaults is 6p].
+s[[dx/dy/][shade]] to draw an offset background shaded region. Here, dx/dy indicates the shift relative to the foreground frame [default is 4p/-4p] and shade sets the fill style to use for shading [default is gray50].
- -Gzlo/zhi
Truncate the incoming CPT so that the lowest and highest z-levels are to zlo and zhi. If one of these equal NaN then we leave that end of the CPT alone. The truncation takes place before the plotting.
- -I[max_intens|low_i/high_i]
Add illumination effects. Optionally, set the range of intensities from -max_intens to +max_intens. If not specified, 1 is used. Alternatively, append low/high intensities to specify an asymmetric range [Default is no illumination].
- -Jparameters
Specify the projection. (See full description) (See cookbook summary) (See projections table).
-L[i][gap]
Gives equal-sized color rectangles. Default scales rectangles according to the z-range in the CPT (Also see -Z). If gap is appended and the CPT is discrete we will center each annotation on each rectangle, using the lower boundary z-value for the annotation. If i is prepended we annotate the interval range instead. If -I is used then each rectangle will have its constant color modified by the specified intensity.
- -M
Force a monochrome graybar using the (television) YIQ transformation.
- -N[p|dpi]
Controls how the color scale should be encoded graphically. To preferentially draw color rectangles (e.g., for discrete colors), append p. Otherwise we will preferentially draw images (e.g., for continuous colors). Optionally append effective dots-per-inch for rasterization of color scales [600].
- -Q
Select logarithmic scale and power of ten annotations. All z-values in the CPT will be converted to p = log10(z) and only integer p values will be annotated using the 10^p format [Default is linear scale].
- -Rwest/east/south/north[/zmin/zmax][+r][+uunit]
west, east, south, and north specify the region of interest, and you may specify them in decimal degrees or in [±]dd:mm[:ss.xxx][W|E|S|N] format Append +r if lower left and upper right map coordinates are given instead of w/e/s/n. The two shorthands -Rg and -Rd stand for global domain (0/360 and -180/+180 in longitude respectively, with -90/+90 in latitude). Set geographic regions by specifying ISO country codes from the Digital Chart of the World using -Rcode1,code2,…[+r|R[incs]] instead: Append one or more comma-separated countries using the 2-character ISO 3166-1 alpha-2 convention. To select a state of a country (if available), append .state, e.g, US.TX for Texas. To specify a whole continent, prepend = to any of the continent codes AF (Africa), AN (Antarctica), AS (Asia), EU (Europe), OC (Oceania), NA (North America), or SA (South America). Use +r to modify the bounding box coordinates from the polygon(s): Append inc, xinc/yinc, or winc/einc/sinc/ninc to adjust the region to be a multiple of these steps [no adjustment]. Alternatively, use +R to extend the region outward by adding these increments instead, or +e which is like +r but it ensures that the bounding box extends by at least 0.25 times the increment [no extension]. Alternatively for grid creation, give Rcodelon/lat/nx/ny, where code is a 2-character combination of L, C, R (for left, center, or right) and T, M, B for top, middle, or bottom. e.g., BL for lower left. This indicates which point on a rectangular region the lon/lat coordinate refers to, and the grid dimensions nx and ny with grid spacings via -I is used to create the corresponding region. Alternatively, specify the name of an existing grid file and the -R settings (and grid spacing and registration, if applicable) are copied from the grid. Appending +uunit expects projected (Cartesian) coordinates compatible with chosen -J and we inversely project to determine actual rectangular geographic region. For perspective view (-p), optionally append /zmin/zmax. In case of perspective view (-p), a z-range (zmin, zmax) can be appended to indicate the third dimension. This needs to be done only when using the -Jz option, not when using only the -p option. In the latter case a perspective view of the plane is plotted, with no third dimension.
For perspective view -p, optionally append /zmin/zmax. (more …)
- -S[+aangle][+c|n][+s][+xlabel][+yunit]
Control various aspects of color bar appearance when -B is not used. Append +a to place annotations at the given angle [default is no slanting]. Append +c to use custom labels if given in the CPT as annotations. Append +n to use numerical labels [Default]. Append +s to skip drawing gridlines separating different color intervals [Default draws gridlines]. If -L is used then -B cannot be used, hence you may optionally set a bar label via +xlabel and any unit (i.e., y-label) via +yunit.
- -U[label|+c][+jjust][+odx/dy]
Draw GMT time stamp logo on plot. (See full description) (See cookbook information).
- -V[level]
Select verbosity level [w]. (See full description) (See cookbook information).
- -Wscale
Multiply all z-values in the CPT by the provided scale. By default the CPT is used as is.
- -X[a|c|f|r][xshift]
Shift plot origin. (See full description) (See cookbook information).
- -Y[a|c|f|r][yshift]
Shift plot origin. (See full description) (See cookbook information).
- -Zzfile
File with colorbar-width per color entry. By default, width of entry is scaled to color range, i.e., z = 0-100 gives twice the width as z = 100-150 (Also see -L).
- -p[x|y|z]azim[/elev[/zlevel]][+wlon0/lat0[/z0]][+vx0/y0] (more …)
Select perspective view. (Required -R and -J for proper functioning).
- -ttransp[/transp2] (more …)
Set transparency level(s) in percent.
- -^ or just -
Print a short message about the syntax of the command, then exit (NOTE: on Windows just use -).
- -+ or just +
Print an extensive usage (help) message, including the explanation of any module-specific option (but not the GMT common options), then exit.
- -? or no arguments
Print a complete usage (help) message, including the explanation of all options, then exit.
- --PAR=value
Temporarily override a GMT default setting; repeatable. See gmt.conf for parameters.
Examples
Note: Since many GMT plot examples are very short (i.e., one module call between the gmt begin and gmt end commands), we will often present them using the quick modern mode GMT Modern Mode One-line Commands syntax, which simplifies such short scripts.
To plot a horizontal color scale (12 cm long; 0.5 cm wide) at the reference point (8,1) (paper coordinates) with justification at top center and automatic annotation interval, do
gmt begin map
  gmt makecpt -T-200/1000/100 -Crainbow
  gmt colorbar -Dx8c/1c+w12c/0.5c+jTC+h -Bxaf+l"topography" -By+lkm
gmt end show
To append a vertical color scale (7.5 cm long; 1.25 cm wide) to the right of a plot that is 6 inch wide and 4 inch high, using illumination, and show back- and foreground colors, and annotating every 5 units, we provide the reference point and select the left-mid anchor point via
gmt colorbar -Dx6.5i+jLM/2i+w7.5c/1.25c+e -Ccolors.cpt -I -Bx5+lBATHYMETRY -By+lm
To overlay a horizontal color scale (4 inches long and default width) above a Mercator map produced by a previous call, ensuring a 2 cm offset from the map frame, use
gmt colorbar -DjCT+w4i+o0/2c+h -Ccolors.cpt -Baf
Notes
When the CPT is discrete and no illumination is specified, the color bar will be painted using polygons. For all other cases we must paint with an image. Some color printers may give slightly different colors for the two methods given identical RGB values. See option -N for affecting these decisions. Also note that for years now, Apple’s Preview insists on smoothing deliberately course CPT color images to a blur. Use another PDF viewer if this bothers you.
For cyclic (wrapping) color tables the cyclic symbol is plotted to the right of the color bar. If annotations are specified there then we place the cyclic symbol at the left, unless +n was used in which case we center of the color bar instead.