fzmodeler
Bash script to build fracture zone cross-profile model
Synopsis
fzmodeler [ -Aasymmetry ] [ -Ccompression ] [ -Dmin/max/inc ] [ -Gcomp ] [ -M ] [ -Namplitude ] [ -O ] [ -P ] [ -Sshift ] [ -Tprefix ] [ -V[level] ] [ -Wwidth ]
Note: No space is allowed between the option flag and the associated arguments.
Description
zmodeler is a script developed as part of the Global Seafloor Fabric and Magnetic Lineation Project [see GSFML for a full description of the project]. It builds a synthetic model cross-profile given the chosen model parameters and optionally images the profile via a PDF plot. The model evaluated is \(z(x) = A[mG_1 + (1-m)(uG_2 - G_0)]\), where A is amplitude (-N), m is asymmetry (-A), and u is compression (-C). Here \(G_0\) is the Gaussian function, while \(G_1\) and \(G_2\) are the first two horizontal derivatives. Note: The blend model subtracts Here \(G_0\) since for fracture zones we want the negative Gaussian.
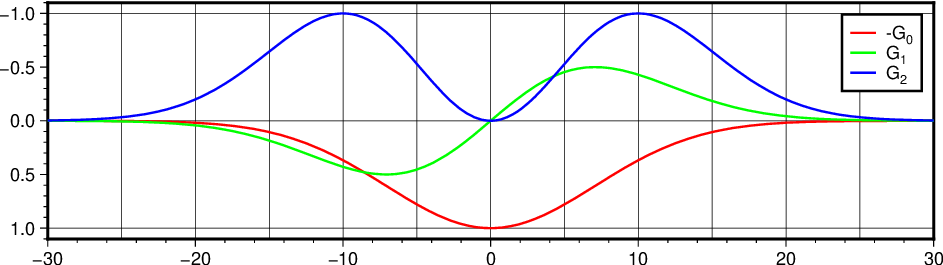
Three components (the Gaussian and its two first derivatives) can be used to create a blended model that matches a FZ-crossing VGG anomaly. Modeling may also require a linear trend.
Optional Arguments
- -Aasymmetry
Sets the asymmetry parameter used for the blend between symmetric (“Atlantic”) and asymmetric (“Pacific”) signals [0].
- -Ccompression
Sets the amount of compression (0-1) to use in the blending [0].
- -Dmin/max/inc
Sets the domain for which to evaluate the model. If -M is used then the domain is expected to be in km; otherwise min and max will be expected to be in degrees of latitude which inc will be decoded as arc minutes [-5/5/2 or -100/100/2, depending on -M].
- -Gcomp
Only plot component \(G_i(x)\), where i = 0, 1, or 2
- -M
The chosen domain (-D) is given degrees of latitude, with increment in arc minutes [Default is in km].
- -Namplitude
Sets the peak-to-trough amplitude of the blended signal [100].
- -O
Instead of making a stand-alone PDF plot, write a PostScript overlay to stdout, i.e., make the plot using the GMT classic code -O -K options. Requires (or sets) -P.
- -P
Produce a PDF plot (named prefix.pdf) of the synthetic FZ profile [no plot].
- -Sshift
Sets the shift of the FZ location from the origin, in km [0].
- -Tprefix
Set the output prefix for the model profile [fzprof]. Give -T- to send the model profile to stdout.
- -V[level]
Select verbosity level [w]. (See full description) (See technical reference).
- -Wwidth
Sets the full width of the FZ, in km [25].
Examples
To plot a synthetic profile for the Pacific, using otherwise default arguments, try:
fzmodeler -C1 -V
The final plot will be named prefix.pdf, with the model data in prefix.txt. To just plot normalized component \(G_2(x)\), try:
fzmodeler -D-30/30/1 -C1 -N1 -W10 -G2 -T- | gmt plot -W1p -B -R-30/30/-1/1 -png G2
See Also
gmt fzanalyzer, fzblender mlconverter, fzinformer, fzprofiler, fzmapper,
References
Wessel, P., Matthews, K. J., Müller, R. D., Mazzoni, A., Whittaker, J. M., Myhill, R., Chandler, M. T., 2015, “Semiautomatic fracture zone tracking”, Geochem. Geophys. Geosyst., 16 (7), 2462–2472. https://doi.org/10.1002/2015GC005853.