(43) Robust regression and outlier detection
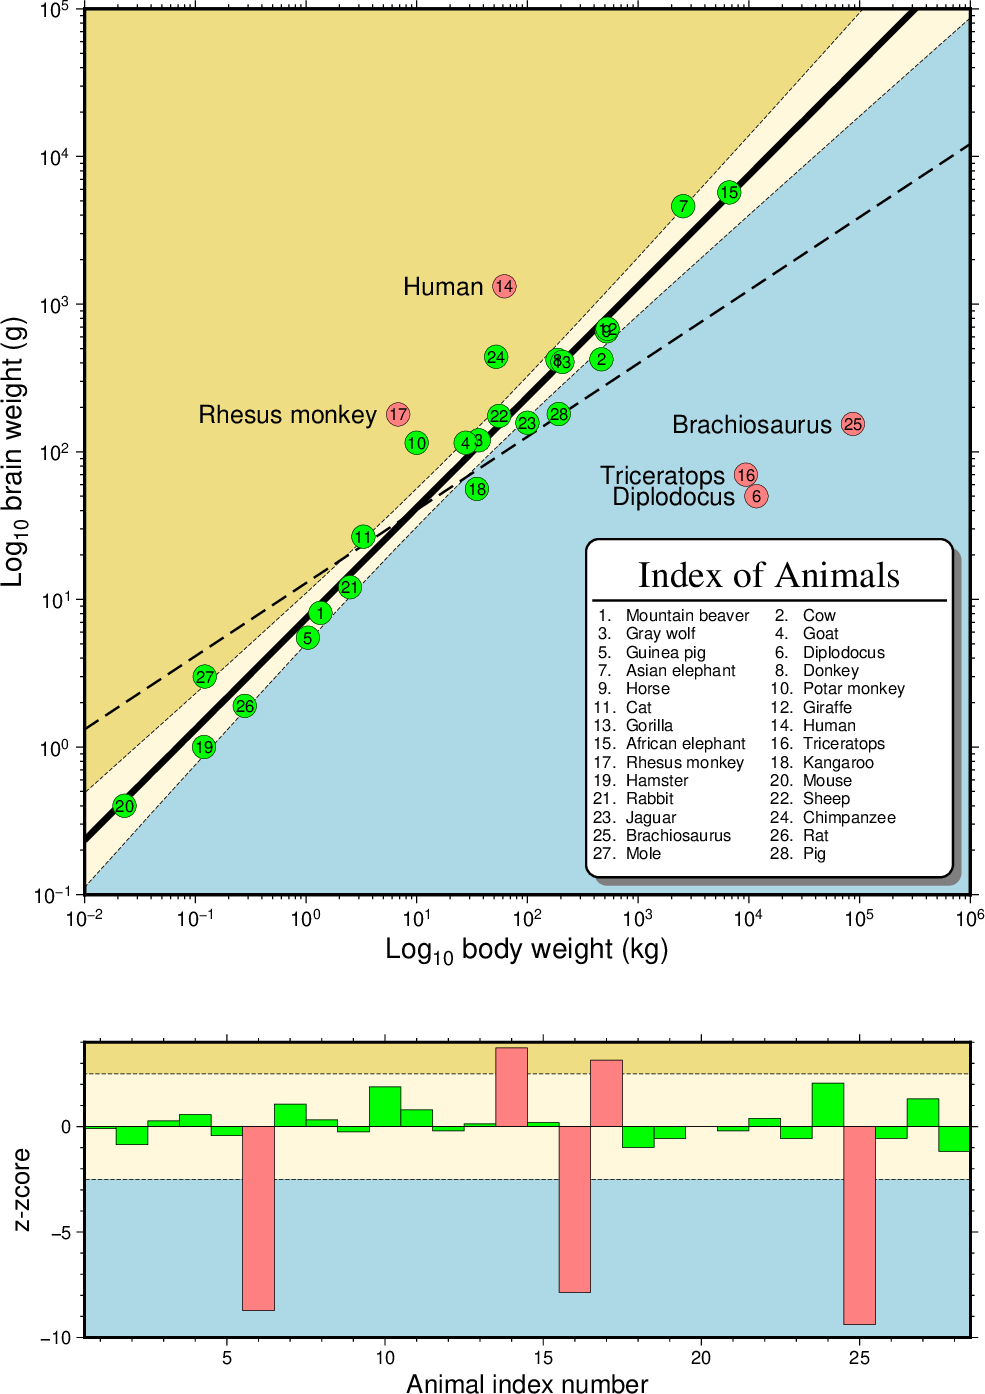
In this example show how gmtregress can be used to determine a robust regression line using reweighted least squares and from this fit we are able to identify outliers with respect to the main trend. The result shows dinosaurs were large and dumb, humans and some monkeys pretty smart, and the rest of the mammals doing alright. Band shows 99% confidence internal on regression.
#!/usr/bin/env bash
#               GMT EXAMPLE 43
#
# Purpose:      Illustrate regression and outlier detection
# GMT modules:  gmtregress, basemap, legend, text, plot
# Unix progs:   cat, grep, awk, sed, rm
#

# set AWK to awk if undefined
AWK=${AWK:-awk}

# Data from Table 7 in Rousseeuw and Leroy, 1987.
gmt begin ex43

	file=$(gmt which -Gc @bb_weights.txt)
	gmt regress -Ey -Nw -i0:1+l $file > model.txt
	gmt regress -Ey -Nw -i0:1+l $file -Fxmc -T-2/6/0.1 -C99 > rls_line.txt
	gmt regress -Ey -N2 -i0:1+l $file -Fxm -T-2/6/2+n > ls_line.txt
	grep -v '^>' model.txt > A.txt
	grep -v '^#' $file > B.txt
	$AWK '{if ($7 == 0) printf "%dp\n", NR}' A.txt > sed.txt
	gmt makecpt -Clightred,green -T0/2/1 -F+c -N
	gmt basemap -R0.01/1e6/0.1/1e5 -JX15cl -Ba1pf3 -Bx+l"Log@-10@- body weight (kg)" -By+l"Log@-10@- brain weight (g)" -BWSne+glightblue -Y10c
	gmt plot -R-2/6/-1/5 -JX15c rls_line.txt -L+yt -Glightgoldenrod
	sed -n -f sed.txt B.txt | gmt text -R0.01/1e6/0.1/1e5 -JX15cl -F+f12p+jRM -Dj10p
	gmt plot -R-2/6/-1/5 -JX15c -L+d+p0.25p,- -Gcornsilk1 rls_line.txt
	gmt plot rls_line.txt -W3p
	gmt plot ls_line.txt -W1p,-
	gmt plot -Sc0.4c -C -Wfaint -i0,1,6 model.txt
	gmt text A.txt -F+f8p+jCM+r1 -B0
	# Build legend
	cat <<- EOF > legend.txt
	H 18p,Times-Roman Index of Animals
	D 1p
	N 7 43 7 43
	EOF
	$AWK -F'\t' '{printf "L - C %d.\nL - L %s\n", NR, $NF}' B.txt >> legend.txt
	gmt legend -DjBR+w6c+o0.4c -F+p1p+gwhite+s+c3p+r legend.txt --FONT_LABEL=8p
	gmt basemap -R0.5/28.5/-10/4 -JX15c/5c -Y-7.5c -B+glightgoldenrod
	gmt plot -Gcornsilk1 -W0.25p,- <<- EOF
	>
	0	-2.5
	30	-2.5
	30	2.5
	0	2.5
	> -Glightblue
	0	-10
	30	-10
	30	-2.5
	0	-2.5

	EOF
	$AWK '{print NR, $6, $7}' A.txt | gmt plot -Sb1q+b0 -W0.25p -C
	gmt basemap -Bafg100 -Bx+l"Animal index number" -By+l"z-zcore" -BWSne
	rm -f *.txt
gmt end show

Robust Regression and Outlier Detection.