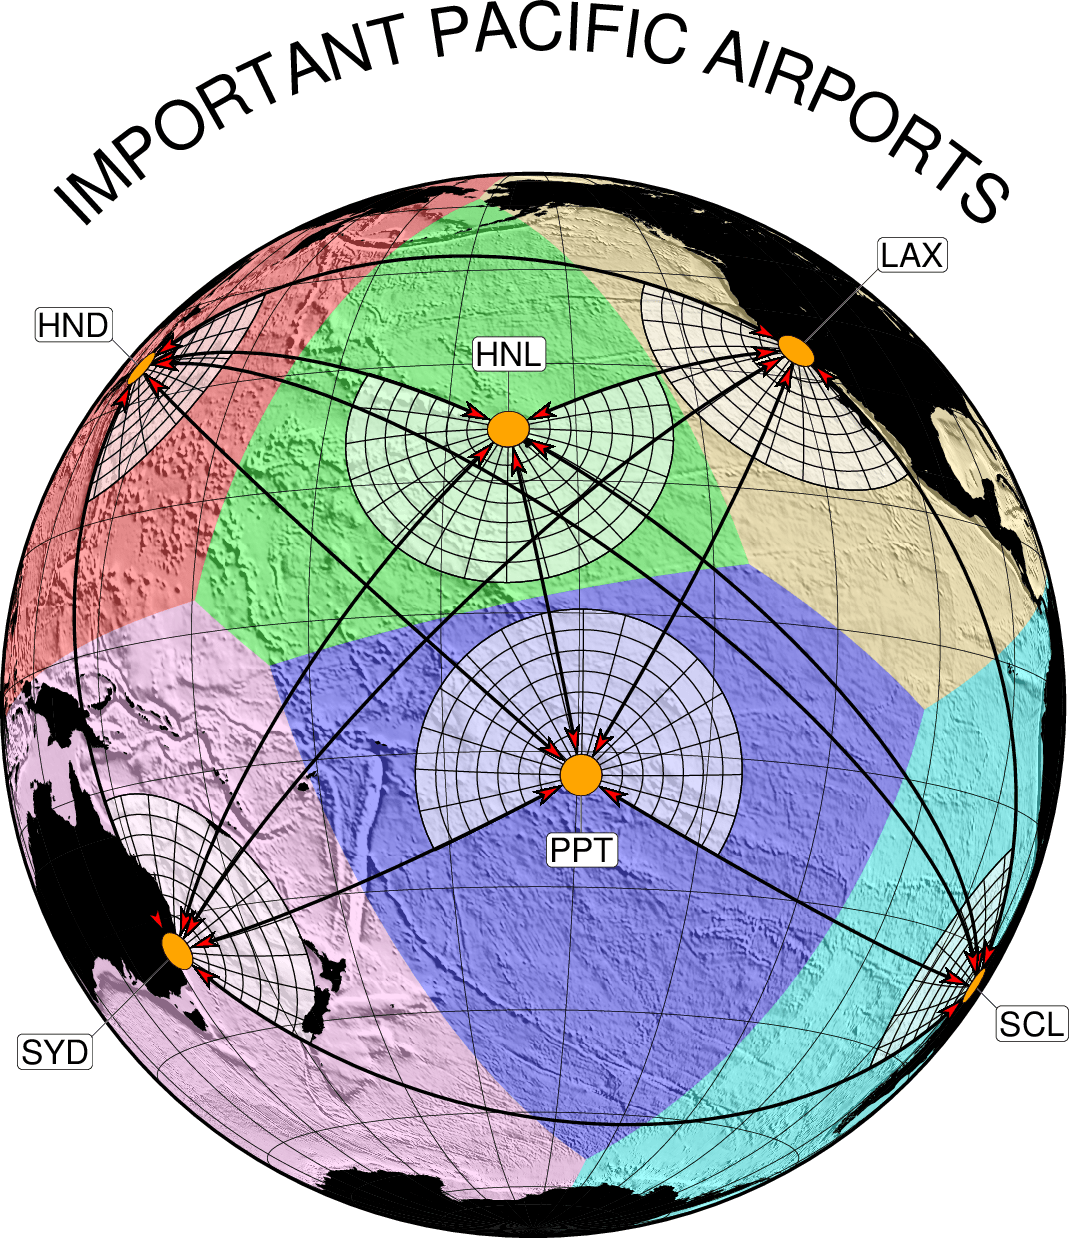
(48) Line networks, map embellishments, and curved titles
In this example we show how the module plot can be used to create a network of lines based on a file with just the nodes (the siz airports). We also demonstrate how the lines can be shortened by (a) a given measure (here 250 km) and then (b) the length of the added vector heads. The airspace closest to each airport is identified as spherical Voronoi cells by sphtriangulate and filled with transparent coloring, allowing us to see the seafloor texture beneath. Finally, we add six local spiderweb azimuth/distance gridlines and set a curved plot title.
#!/usr/bin/env bash
#               GMT EXAMPLE 48
#
# Purpose:      Illustrate use of trimmed lines with vectors, networks, and local spiderwebs
# GMT modules:  makecpt, coast, plot, sphtriangulate, grdimate, gmtmath, text
#

gmt begin ex48
	cat <<- EOF > airports.txt
	157.8583W	21.3069N	61   300	HNL	BC	1.5c
	149.5585W	17.5516S	-120 120	PPT	TC	1.5c
	139.6917E	35.6895N	56   170	HND	RB	0.75c
	70.6693W	33.4489S	215  322	SCL	TL	0.6c
	151.2070E	33.8675S	-10  145	SYD	TR	2.1c
	118.2437W	34.0522N	142  306	LAX	BL	2c
	EOF
	gmt makecpt -Clightgray -T-12000,12000 -N
	gmt grdimage @earth_relief_10m -I+a45+nt2 -Rg -JG205/-10/18c
	gmt sphtriangulate airports.txt -Qv > near_area.txt
	gmt makecpt -Ccategorical -T0/6/1 -N
	gmt plot near_area.txt -L -C -t65
	# Make a 15 degrees by 250 km spiderweb grid around each airport
	gmt plot -SW2000k/250k+a250k+r15 -W0.5p -Gwhite@40 airports.txt
	gmt coast -Gblack -A500 -Bafg
	# Then place custom labels.
	while read lon lat az1 az2 label just off; do
		echo $lon $lat $label | gmt text -DJ${off}+v0.5p,white -F+f16p+j${just} -N
		echo $lon $lat $label | gmt text -DJ${off}+v0.25p -F+f16p+j${just} -N -Gwhite -W0.25p -C+tO
	done < airports.txt
	# Plot trimmed lines and overlay airport locations
	gmt plot airports.txt -Fn -W1.5p+o250k+v0.5c+gred+h0.5
	gmt plot airports.txt -SE-500 -Gorange -W0.25p
	# Make an arc of radius 11.5 cm from 45 to 135 degrees around map center and use it to place text
	gmt math -T45/135/1 T -C0 COSD -C1 SIND -Ca 11.5 MUL = path.txt
	# Move up 9 cm so origin is at the map center
	gmt plot -R-9/9/0/18 -Jx1c -Y9c path.txt -Sqn1:+l"IMPORTANT PACIFIC AIRPORTS"+v+f32p -Wfaint,white -N
	rm -f airports.txt near_area.txt path.txt
gmt end show
Line networks, map embellishments, and curved titles.