psevents
Plot event symbols and labels for a moment in time
Synopsis
gmt psevents [ table ] -Jparameters -Rwest/east/south/north[/zmin/zmax][+r][+uunit] -Ssymbol[size] -Tnow [ -B[p|s]parameters ] [ -Ccpt ] [ -D[j|J]dx[/dy][+v[pen]] ] [ -Es|t[+o|Odt][+rdt][+pdt][+ddt][+fdt][+ldt] ] [ -F[+aangle][+ffont][+jjustify][+r[first]|z[format]] ] [ -Gcolor ] [ -K ] [ -L[length|t] ] [ -Mi|s|t[val1][+cval2] ] [ -O ] [ -P ] [ -Qprefix ] [ -U[stamp] ] [ -V[level] ] [ -Wpen ] [ -X[a|c|f|r][xshift] ] [ -Y[a|c|f|r][yshift] ] [ -bibinary ] [ -dinodata ] [ -eregexp ] [ -fflags ] [ -hheaders ] [ -iflags ] [ -pflags ] [ -qiflags ] [ -:[i|o] ] [ --PAR=value ]
Note: No space is allowed between the option flag and the associated arguments.
Description
Reads (x, y[, z] [, size], time [, length] [, label]) data from table [or standard input] and plots how the symbol for each event should look for the specified now time. The reason they may differ is that events may have different lengths and we may wish to accentuate the symbol attributes in ways to draw attention to an event when it first happens and perhaps tone it down after a while to reduce clutter and focus on more recent events. Optionally, each symbol may have a label that can be displayed at the same time or delayed with respect to the symbol. This module is typically used in conjunction with movie where the implicit loop over time is used to call it over a time-sequence and thus plot symbols as events unfold.
Required Arguments
- -Jparameters (more …)
Select map projection.
- -Rxmin/xmax/ymin/ymax[+r][+uunit] (more …)
Specify the region of interest.
For perspective view -p, optionally append /zmin/zmax. (more …)
- -Ssymbol[size]
Specify the symbol to use for the event. Optionally, append symbol size with unit from (c|i|p). If no size is given then we read an event-specific size from the data file’s third column (fourth if -C is used). Note: Not all the symbols that are available in psxy can be used here. At the moment we only support the basic symbols and custom symbols; bars, vectors, ellipses, fronts, decorated and quoted lines cannot be specified. Symbols sizes read from a data file will be assumed to be in the unit controlled by PROJ_LENGTH_UNIT unless they have c, i, or p appended. If you are only plotting labels then -S is not required.
- -Tnow
Set the current plot time. The time shifts and increments set in -E are all relative to this current time. If an absolute time is given you may need to use TIME_UNIT to indicate the unit of the values given in options like -E and -L.
Optional Arguments
- table
One or more ASCII (or binary, see -bi[ncols][type]) data table file(s) holding a number of data columns. If no tables are given then we read from standard input.
- -B[p|s]parameters (more …)
Set map boundary frame and axes attributes.
- -Ccpt
Use the cpt to convert z values given in the optional third column to assign symbol colors.
- -D[j|J]dx[/dy][+v[pen]]
Offset the text from the projected (x,y) point by dx,dy [0/0]. If dy is not specified then it is set equal to dx. Use -Dj to offset the text away from the point instead (i.e., the text justification will determine the direction of the shift). Using -DJ will shorten diagonal offsets at corners by sqrt(2). Optionally, append +v which will draw a line from the original point to the shifted point; append a pen to change the attributes for this line.
- -Es|t[+o|Odt][+rdt][+pdt][+ddt][+fdt][+ldt]
Set the time knots for the symbol or text time-functions. Append +o to shift the event start and end times by a constant offset (basically shifting the event in time by dt; or use +O to only shift the start time, effectively shortening the duration of the event), +r to indicate the duration of the rise phase, +p to set the duration of the plateau phase, +d to specify the duration of the decay phase, and +f to set the duration of the fade phase. These are all optional [and default to zero], and can be set separately for symbols and texts. If neither s or t is given then we set the time knots for both features. Note: The +l modifier is restricted to -Et and specifies an alternative duration (visibility) of the text [same duration as symbol]. Furthermore, the +p and +d periods do not apply to text labels. Note: The -Et option is required if you wish to plot labels [plot symbols only].
- -F[+aangle][+ffont][+jjustify][+r[first]|z[format]]
By default, event label text will be placed horizontally, using the primary annotation font attributes (FONT_ANNOT_PRIMARY), and centered on the data point. Use this option to override these defaults by specifying up to three text attributes (font, angle, and justification) directly on the command line. Use +f to set the font (size,fontname,color), +a to set the angle, and +j to set the justification. Normally, the text to be plotted is the trailing text. Instead, use +r to use the record number (counting up from first [0]) or +z to format incoming z values (requires -C) to a string using the supplied format [use FORMAT_FLOAT_MAP].
- -Gfill (more …)
Set constant shade or color for all symbols.
- -Jz|Zparameters (more …)
Set z-axis scaling; same syntax as -Jx.
- -L[length|t]
Specify the length (i.e., duration) of the event. Append a length if all events have the same length, append t if end-times instead of lengths are given in the file after the time column, or leave blank if lengths can be read from the input file after the time column. If -L is not given we assume events have an infinite duration.
- -Mi|s|t[val1][+cval2]
Modify the initial intensity, size magnification, or transparency of the symbol during the rise interval [1, 1, and 100, respectively]. Repeatable for the different attributes. Optionally, for finite-duration events you may append +c to set the corresponding terminal value during the coda [0, 0, 100, respectively].
- -Qprefix
Save the intermediate event symbols and labels to permanent files instead of removing them when done. Files will be named prefix_symbols.txt and prefix_labels.txt.
- -U[label][+c][+jjust][+odx/dy] (more …)
Draw GMT time stamp logo on plot.
- -V[level] (more …)
Select verbosity level [w].
- -Wpen
Specify symbol outline pen attributes [Default is no outline].
- -bi[ncols][t] (more …)
Select native binary format for primary input. [Default is 3 input columns].
- -dinodata (more …)
Replace input columns that equal nodata with NaN.
- -e[~]“pattern” | -e[~]/regexp/[i] (more …)
Only accept data records that match the given pattern.
- -f[i|o]colinfo (more …)
Specify data types of input and/or output columns.
- -h[i|o][n][+c][+d][+msegheader][+rremark][+ttitle] (more …)
Skip or produce header record(s).
- -icols[+l][+sscale][+ooffset][,…][,t[word]] (more …)
Select input columns and transformations (0 is first column, t is trailing text, append word to read one word only).
- -p[x|y|z]azim[/elev[/zlevel]][+wlon0/lat0[/z0]][+vx0/y0] (more …)
Select perspective view.
- -qi[~]rows[+ccol][+a|f|s] (more …)
Select input rows or data range(s) [all].
- -:[i|o] (more …)
Swap 1st and 2nd column on input and/or output.
- -^ or just -
Print a short message about the syntax of the command, then exit (NOTE: on Windows just use -).
- -+ or just +
Print an extensive usage (help) message, including the explanation of any module-specific option (but not the GMT common options), then exit.
- -? or no arguments
Print a complete usage (help) message, including the explanation of all options, then exit.
- --PAR=value
Temporarily override a GMT default setting; repeatable. See gmt.conf for parameters.
The meaning of time
While normally the meaning of “time” (e.g., such as in the argument to -T) is in fact the time of the phenomenon being plotted, it may also be any other monotonically increasing quantity of convenience, such as elapsed time, model time, frame number, or other physical quantities such as distance. It all depends on the context of the movie. The values given for delays, fades, etc. in -E are assumed to be in the same unit as the given time argument to -T. Thus, if time is a monotonically increasing frame counter then the values in -E and -L refer to number of frames. A special situation occurs when time is in fact actual calendar time given by date/clock markers. Here, the unit of the arguments in -E and -L is determined by the TIME_UNIT setting [second]. You will need to specify the desired time unit that should be used when interpreting your -E and -L arguments. The example below for seismicity uses actual earthquake times but we use days as the unit as second is too small.
The three time-functions
Events typically have either a finite length, e.g., the temporal extent of the reign of a particular monarch, or are infinite. Here, infinite simply means its length exceeds the temporal extent of the time we are plotting. In a movie, a basic representation of these events as points on a map would be to start plotting the symbol when the event starts and then keep the symbol visible on all frames until the event ends (or never stop plotting them in the infinite length case). However, to draw attention to the arrival of a new event we can temporarily change three attributes of the symbol: Its size, color intensity, and transparency. You can think of these three attributes as functions of time. For some option settings, figure below illustrates how the symbol size may vary through the timespan of the movie.
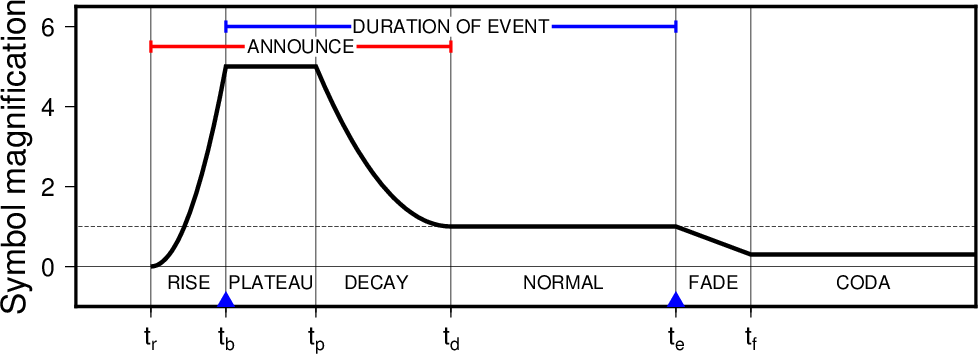
Implied evolution of one symbol’s size-variation as a function of time given the time-knots from -Es and the magnifications from -Ms. Here we temporarily magnify the symbol size five times before decaying to the intended size and eventually shrink it further down to a small size during the fade and coda phases.
Similarly, to draw attention to the newly arrived event you may want to whiten the color temporarily; this can be done via the -Mi option and figure below illustrates how intensity may vary accordingly.
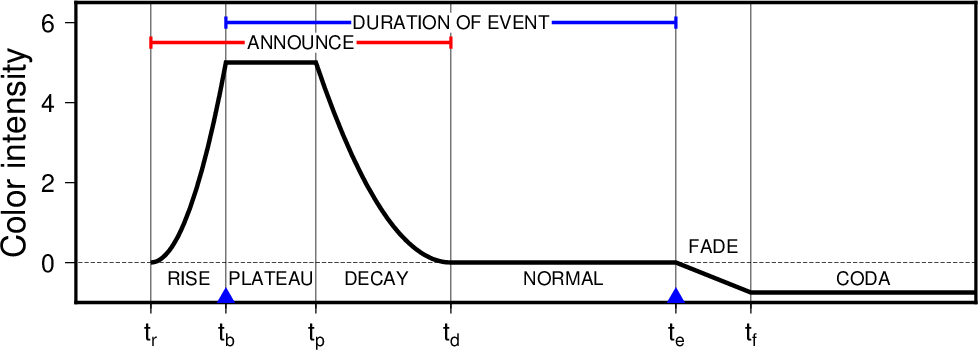
Implied evolution of one symbol’s color intensity as a function of time given the time-knots from -Es and the intensities from -Mi. Here we seek to whiten the symbol during the event arrival, as well as darken it during a permanent code phase.
Finally, for finite events you may wish to either fade them out completely or simply fade them to a constant but still visible transparency; this future stage is referred to as the coda and levels can be specified via the -Mt option. Figure below illustrates how transparency may vary through time.
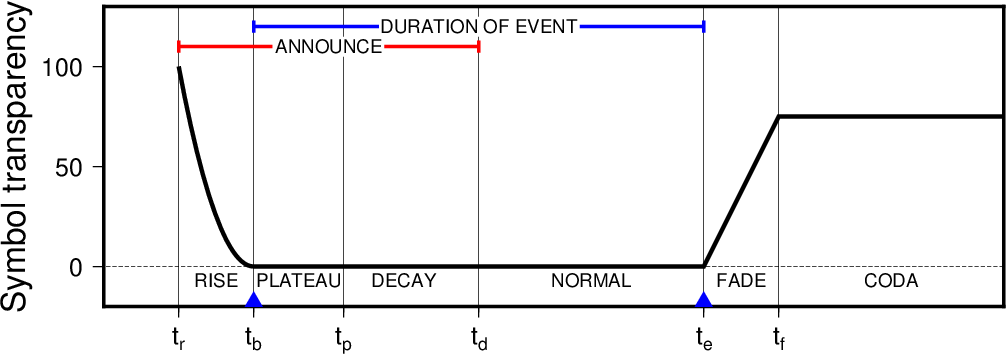
Here we show how a symbol may go from being invisible to reaching full opaqueness at the event begin time, finally fading to a near-invisible stage after reaching its length.
While shown in these examples, the rise, plateau, fade, and coda periods are all optional and can be selected or ignored as you wish via -E. You can choose to specify any or none of the three time histories. By default the symbol size is constant, there is no intensity variation, and all symbols are opaque.
If trailing text is plotted (i.e., by selecting -Et) then only the transparency time-function is used and neither the plateau nor decay periods apply. The appearance and disappearance of a label is thus dictated by an initial (and optional) rise time (during which the label slowly becomes fully visible), an normal period (where it remains visible), followed by the optional fade period (where the text fades out). The figure below illustrate the setup:
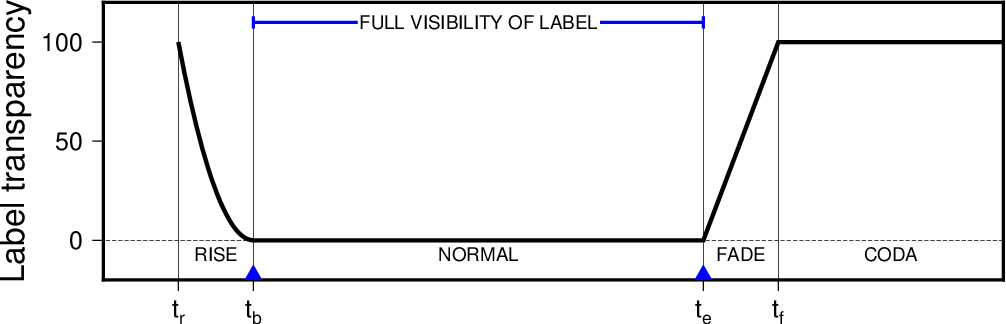
Here we show how a label may go from being invisible to reaching full opaqueness at the event begin time, staying visible for the given duration, and then finally fade away completely. For labels, the plateau and decay periods do not apply.
Sorting the data
While only the events that should be visible will be plotted at the given time set via -T, the order of plotting is simply given by the order of records in the file. Thus, if the file is not sorted into ascending time then later events might plot beneath earlier events. To prevent this, you can sort your file into ascending order via the gmtconvert -N option.
Classic Mode Arguments
These options are used to manipulate the building of layered GMT PostScript plots in classic mode. They are not available when using GMT modern mode.
- -K (more …)
Do not finalize the PostScript plot.
- -O (more …)
Append to existing PostScript plot.
- -P (more …)
Select “Portrait” plot orientation.
Examples
To show the display of events visible for May 1, 2018 given the catalog of large (>5) magnitude earthquakes that year, using a 2-day rise time during which we boost symbol size by a factor of 5 and wash out the color, followed by a decay over 6 days and then a final shrinking to half size and darken the color, we may try
gmt convert "https://earthquake.usgs.gov/fdsnws/event/1/query.csv?starttime=2018-01-01%2000:00:00&endtime=2018-12-31%2000:00:00&minmagnitude=5&orderby=time-asc" \
    -i2,1,3,4+s50,0 -hi1 > q.txt
gmt makecpt -Cred,green,blue -T0,70,300,10000 > q.cpt
gmt psevents -Rg -JG200/5/6i -Baf q.txt -SE- -Cq.cpt --TIME_UNIT=d -T2018-05-01T -Es+r2+d6 -Ms5+c0.5 -Mi1+c-0.6 -Mt+c0 -P > tlayer.ps