Debugging for Developers
GMT developers may need to run GMT in a debugger to figure out the problem reported by an issue. Often there is a bit of detective work involved to find out where a module crashes and then step carefully through that section, examining variables etc., to learn why something fails. This process depends on the particular debug tool one uses. This page will explain the steps a developer must take to build gmt so it is suitable for your debug tool and how to use that tool.
Xcode on macOS
Developers on macOS are most likely to want to use Xcode for this purpose. Chances are they are already using the command-line tools from Xcode (gcc, linker) anyway. To use the GUI part of Xcode you must have installed the full Xcode (you most likely did, but there are ways to only install the command-line tools, so make sure you have an Xcode icon under Applications). Xcode may change as versions change; the images below is for Xcode 10-11.
You will need to make some changes to your cmake/ConfigUserAdvanced.cmake file. Scroll down to the section that says “# Extra debugging for developers:” and uncomment the ~6 lines that has the if-test on “Xcode”. This will pass a few flags that are used when debugging via Xcode. Also uncomment the two “add_definitions” lines that contain the word “DEBUG” in it somewhere.
You will need to build GMT again. I recommend you do this in a separate build directory (I call mine xbuild, and while at it I use rbuild for “Release Builds” and dbuild for regular debug command line builds, and build for the final build for the releases). If you are in the xbuild directory, these two commands will do the build:
cmake -DCMAKE_INSTALL_PREFIX=gmt6 -DCMAKE_BUILD_TYPE=Debug -G Xcode ..
xcodebuild
After this step you can launch the Xcode application and then use the File->Open menu to open the project file xbuild/GMT.xcodeproj. After it opens it may looks something like this (click on the figure to enlarge it):
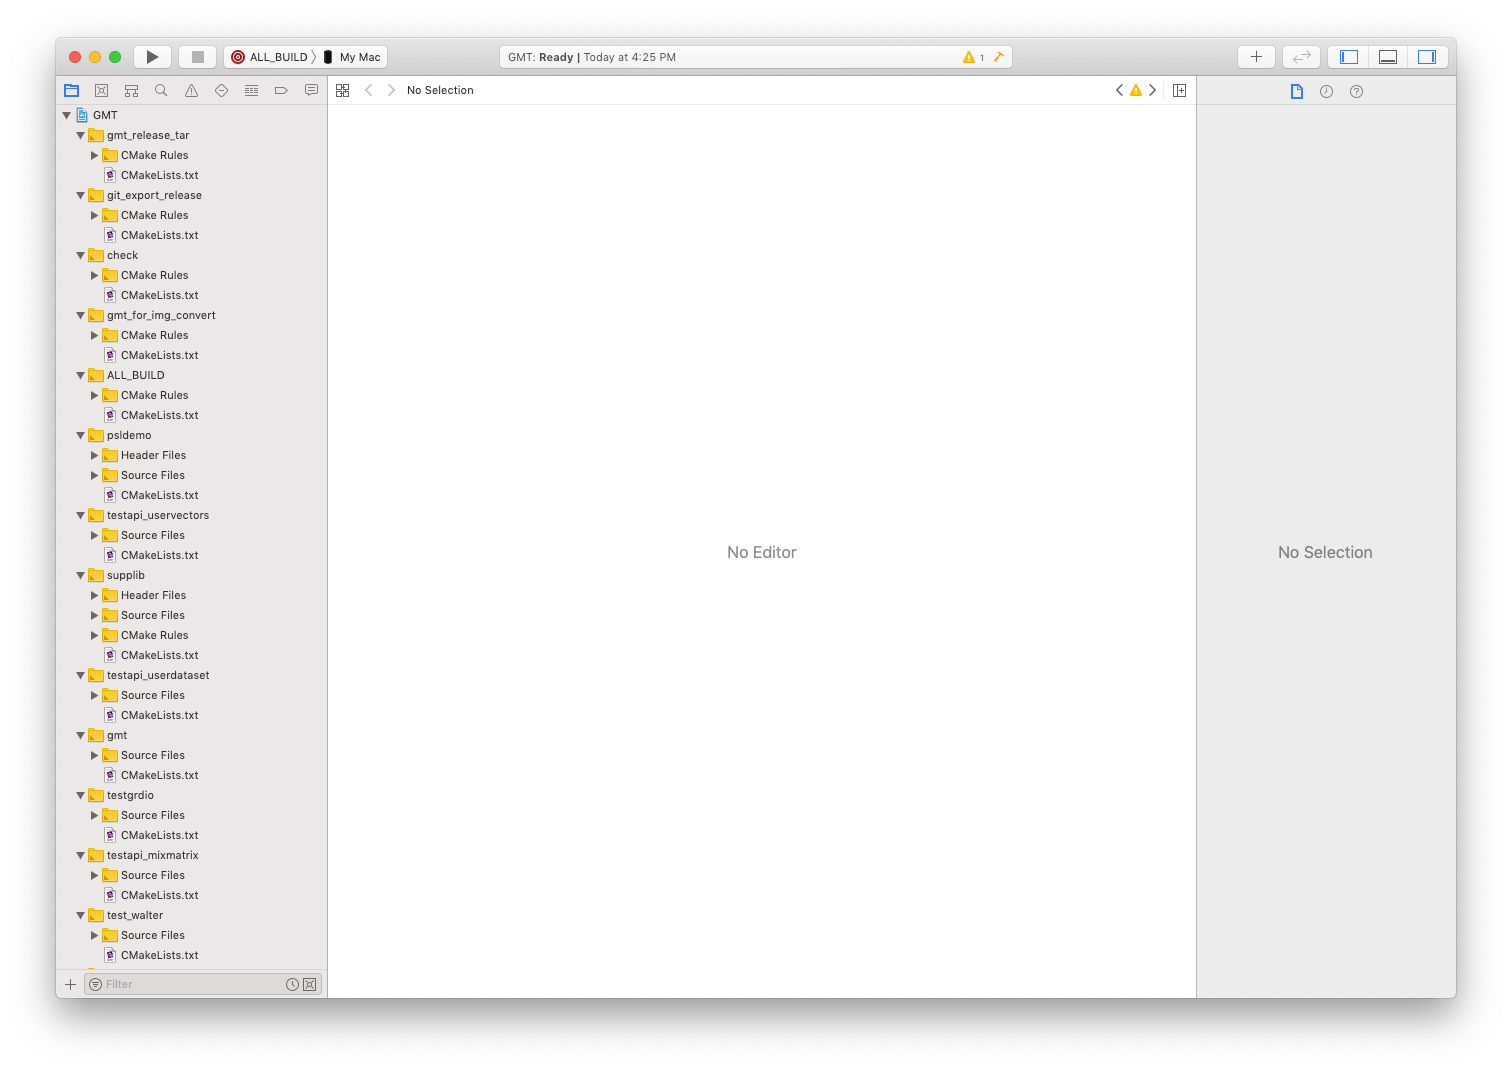
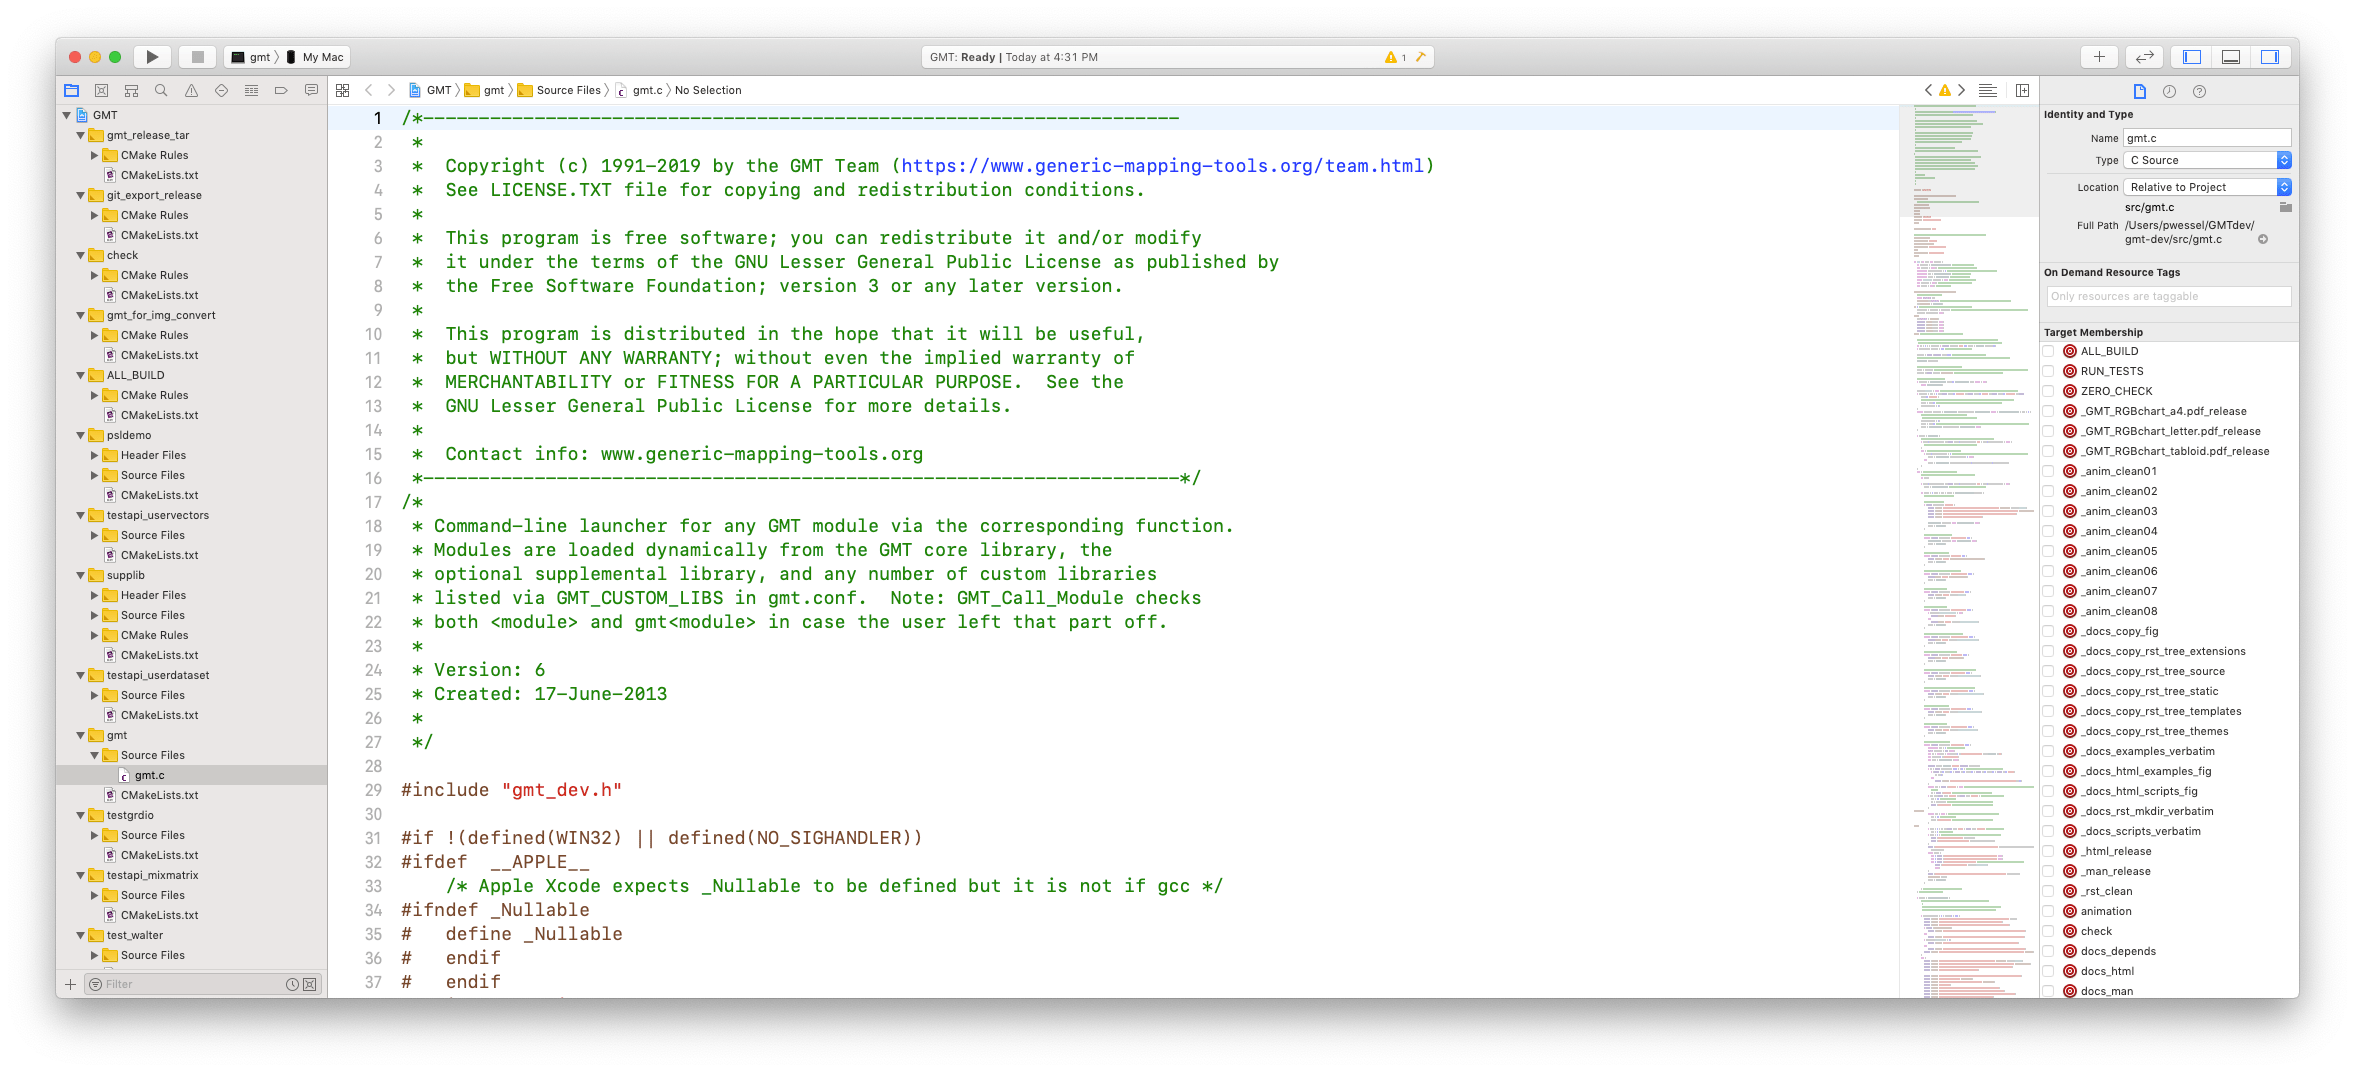
Pull down the tab that says “@ ALL_BUILD” and select “gmt” about 35 lines down, then in the left sidebar open the folder called gmt->Source Files and select gmt.c. Now you may wish to drag the window to be a bit wider so the lines don’t wrap around so much. After that step your screen may look more like this:
Scroll down to the part around line 119 and click the line number to place a stop point; it will add a blue fat arrow at that line:
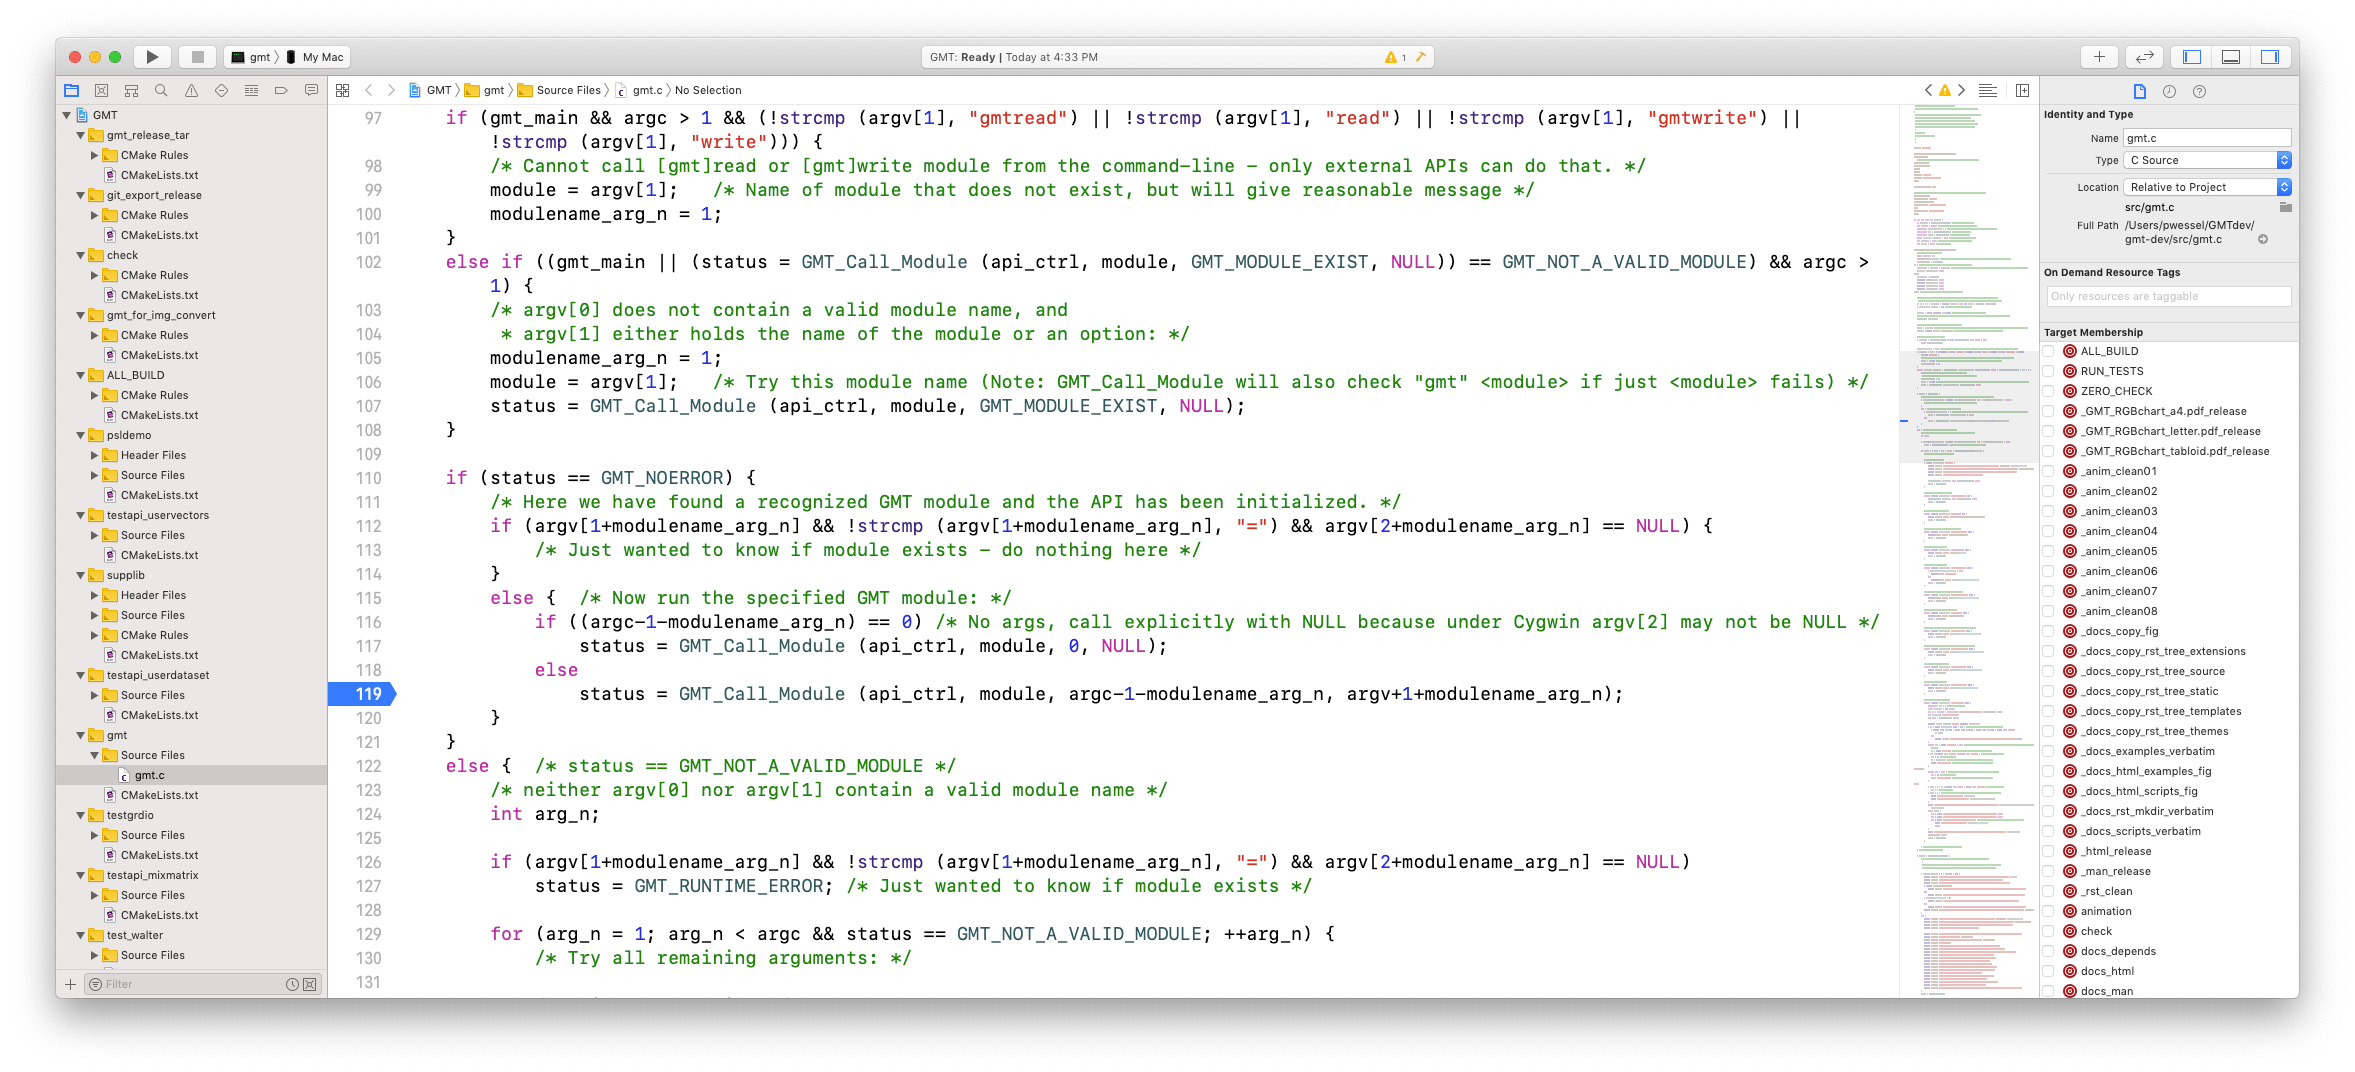
This is usually the first stop you want in Xcode. The exception would be if you are debugging gmt.c itself or you need to examine the code that creates the session via a call to GMT_Create_Session earlier in the program.
Now we need to specify the particular command we wish to debug. Let’s pretend that pstext crashes when we run the command:
gmt pstext my_text.txt -R0/30/-10/20 -JM15c -Baf -F+f16p > text.ps
Copy that command minus the initial “gmt ” part. Now pull down the menu item “Product->Scheme->Edit Scheme”, then make sure “Arguments” is highlighted in blue in the top table, then click the “+” symbol beneath the section that says “Arguments Passed on Launch” and paste in our command; it should result in this display:
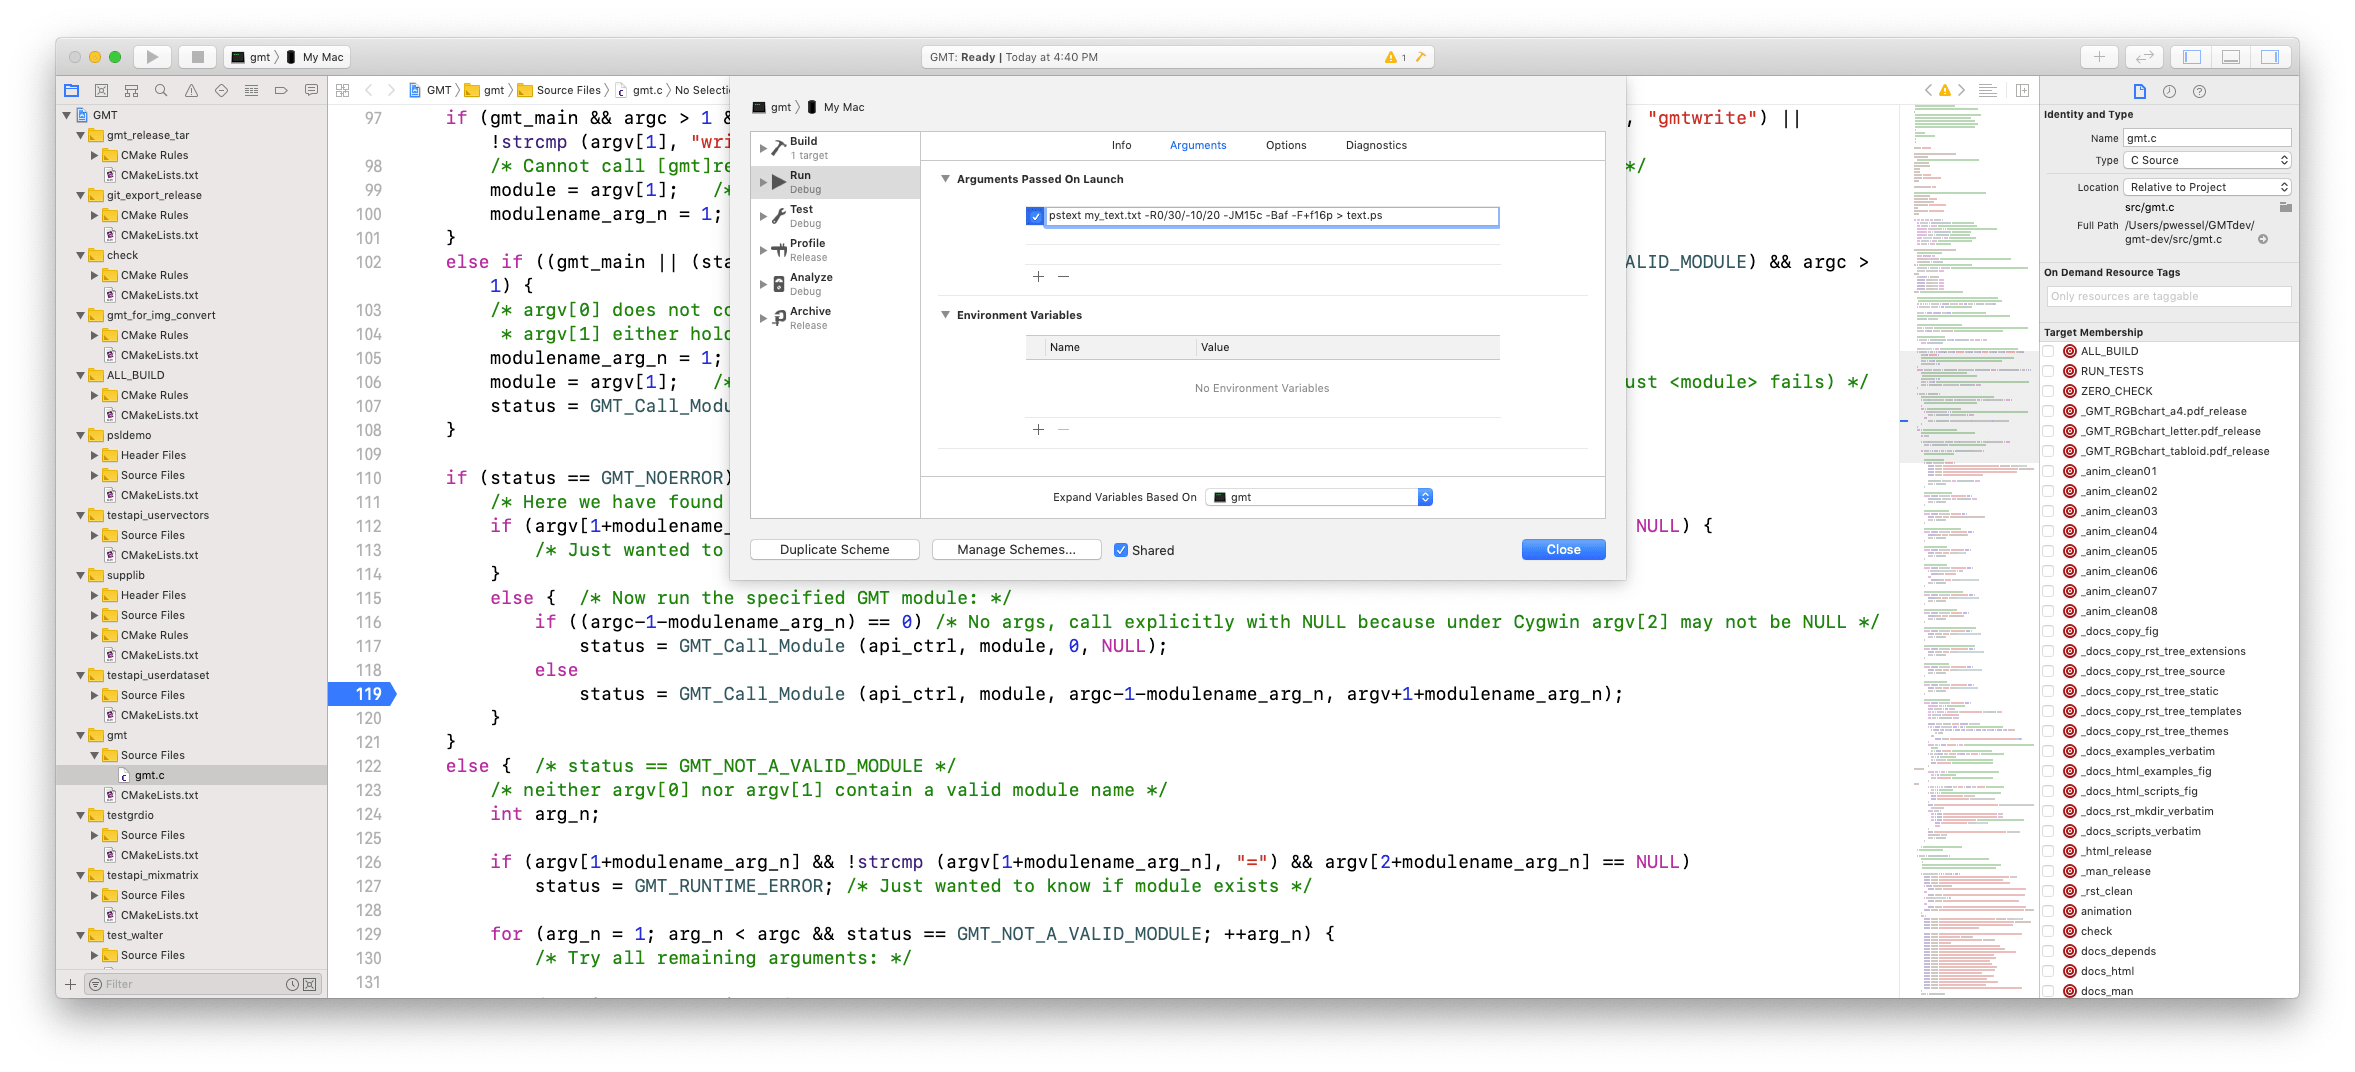
Normally you do not need to set any “Environmental Variables”, but if you are debugging a module that calls an external program (e.g., gs, gdal_translate, etc.) then you may need to add the name PATH and place the path to that program under “Value”. Likewise, if the module needs to find a particular environmental setting like $X2SYS_HOME, then you must set those here as well.
Any data files your command will read must either be placed in the xbuild/src/Debug subdirectory or you must change the command you pasted above to use the full path instead. In other words, when Xcode runs your command, your current directory becomes xbuild/src/Debug.
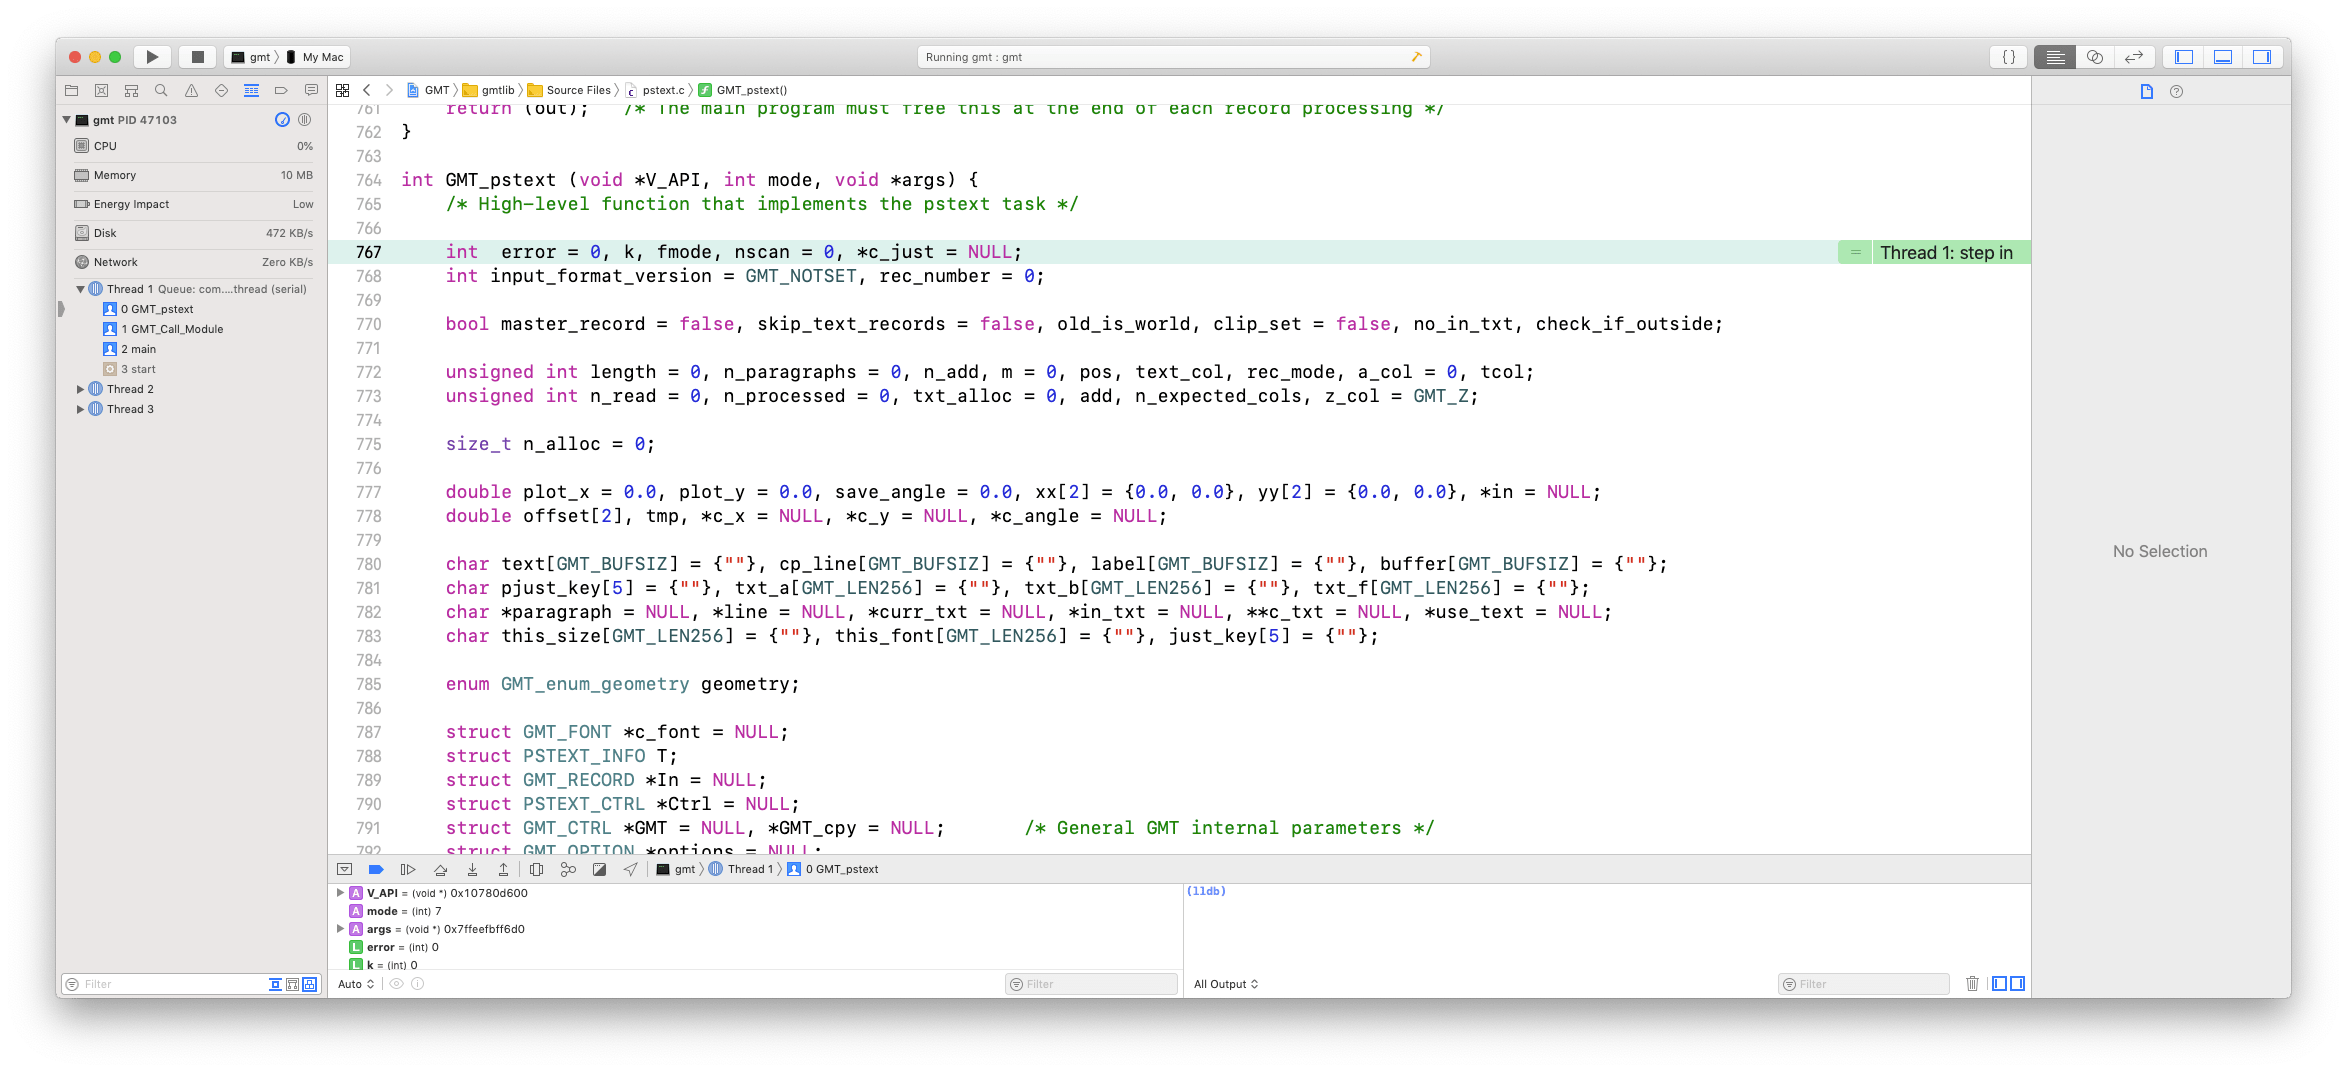
Click close and hit the “Play” button next to the green circle in the top left corner. It may do some building and indexing before it starts and then stops at your highlighted line, opening up a display console below the source code:
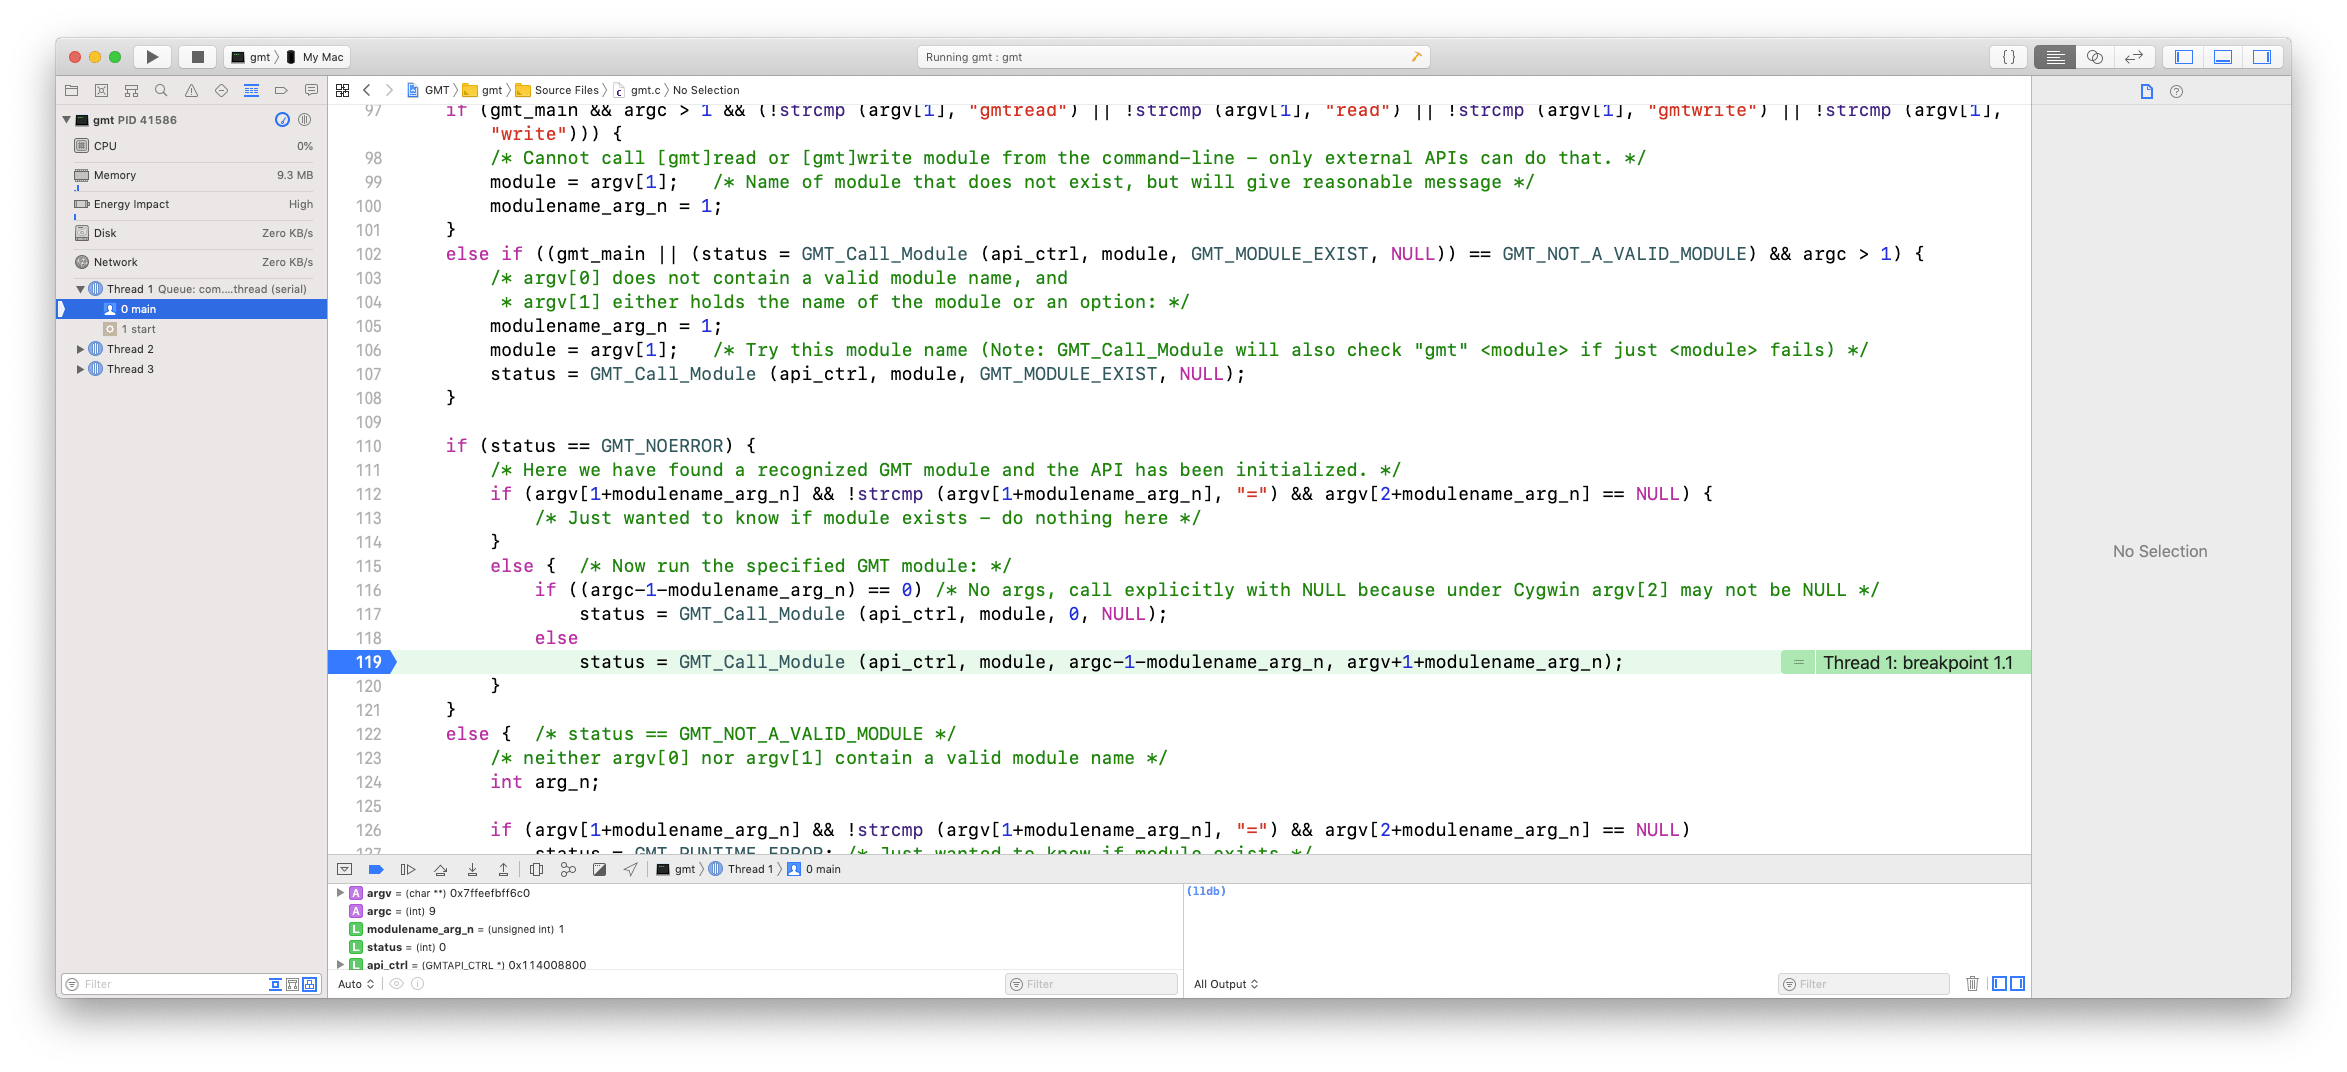
You will see the current line is highlighted light greenish and the execution is stopped. Below the code is a new window that lists some of the variables in the current scope. You can examine that window to see what the variables are set to, you can type “print variable” in the lldb command window on the right (e.g., “print argc”), or you can place the cursor over a variable and a pop-up box will display its value. Below I placed the cursor on the variable “module” on line 119 and this is what it looks like (minus the cursor which is not screen-grabbed!).
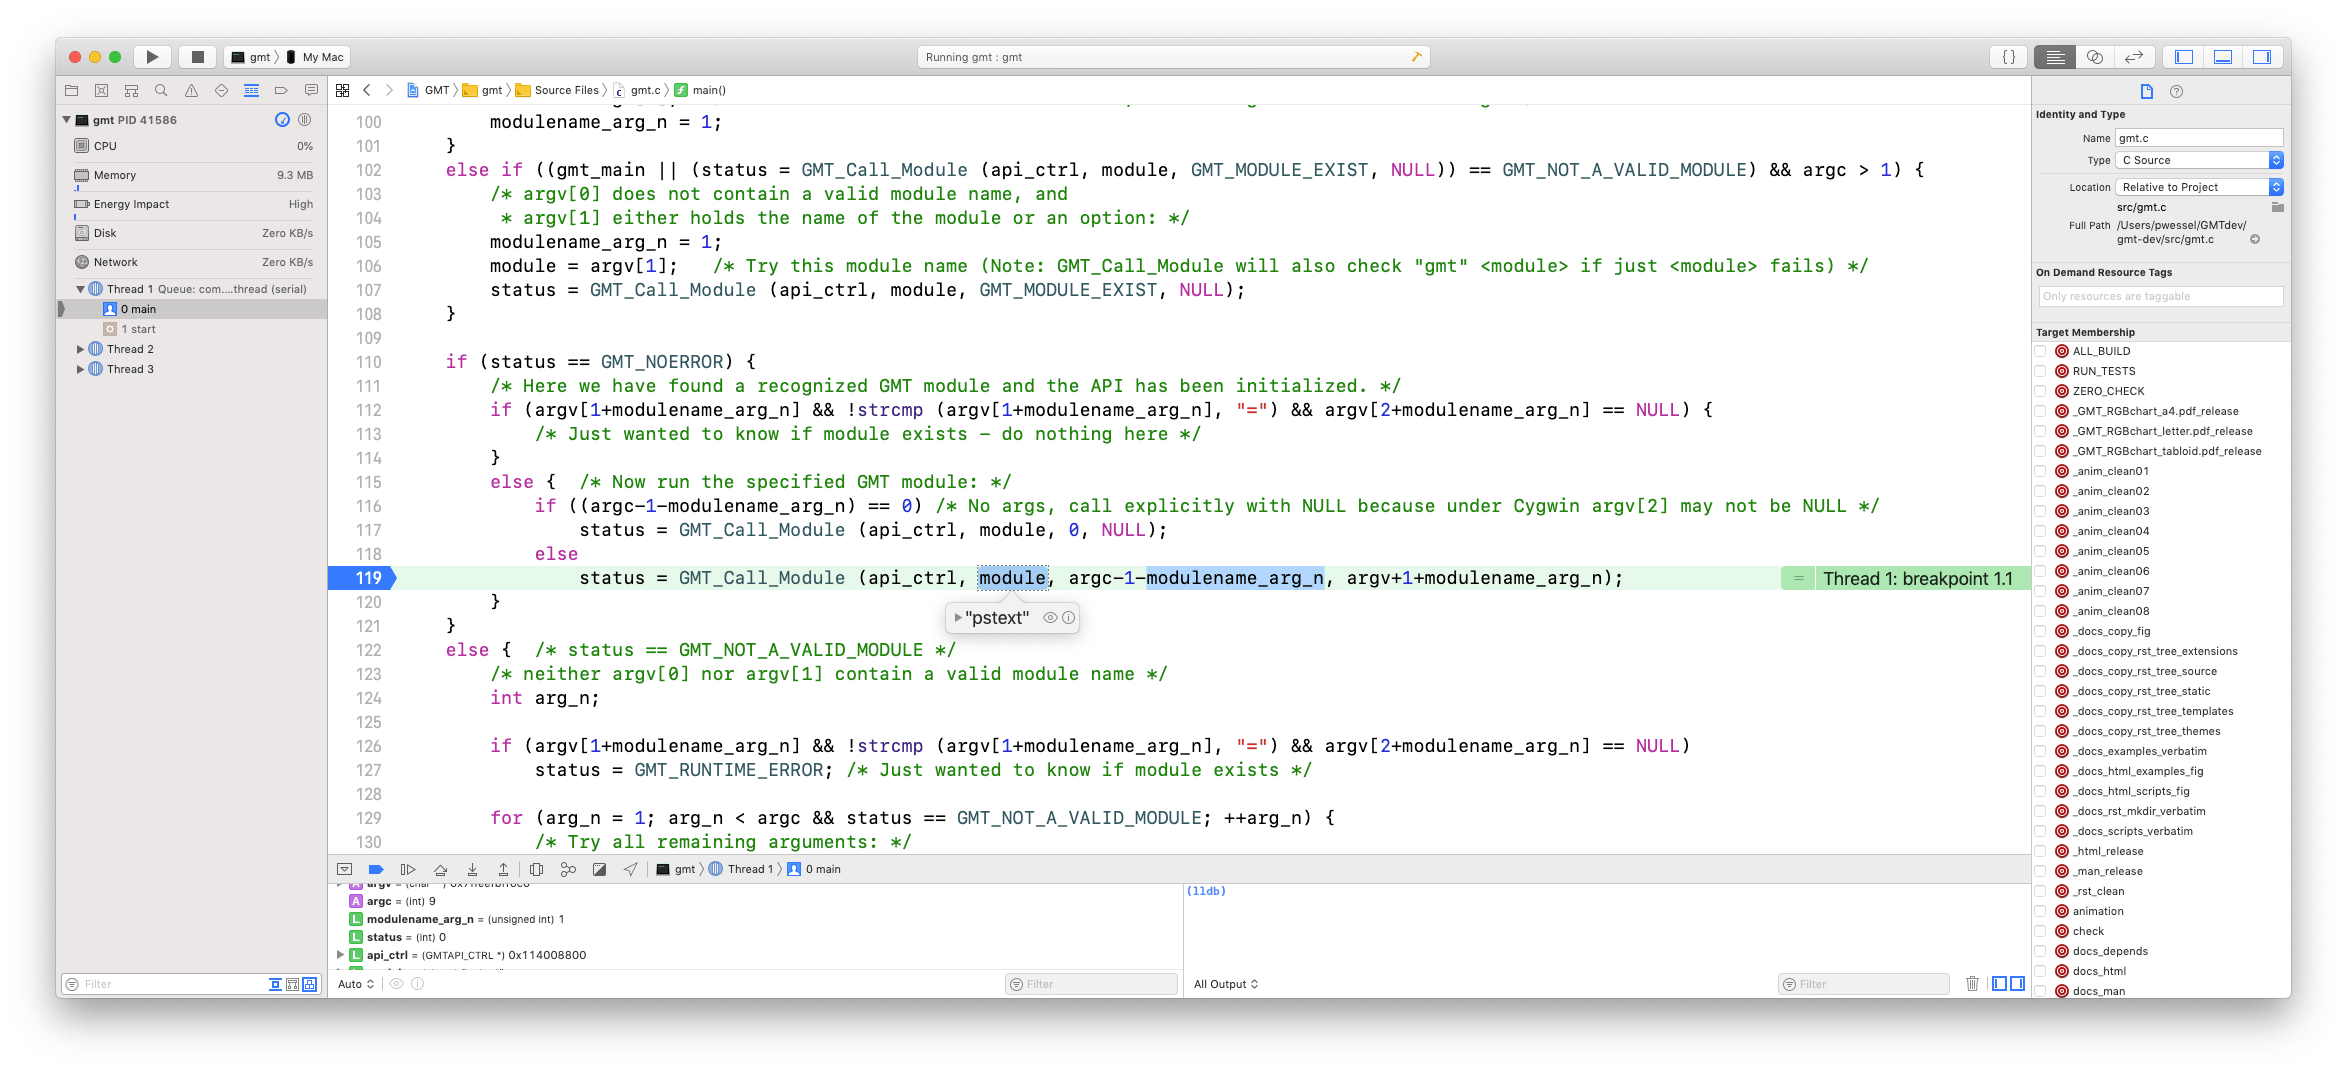
The tool bar below the source code has a pause-play button (continue to next stop point), a step-over button (execute next step but do not go into a function, the step-into button (execute next step which may be going into a function) and the step-out button (finish running current function then step back out). Step into the GMT_Call_Module function using the step-into button, then scroll down to around line 10094 and place another stop point there like I did. Press the pause-play button and you are now about to call your actual C function that correspond to the module (here pstext):
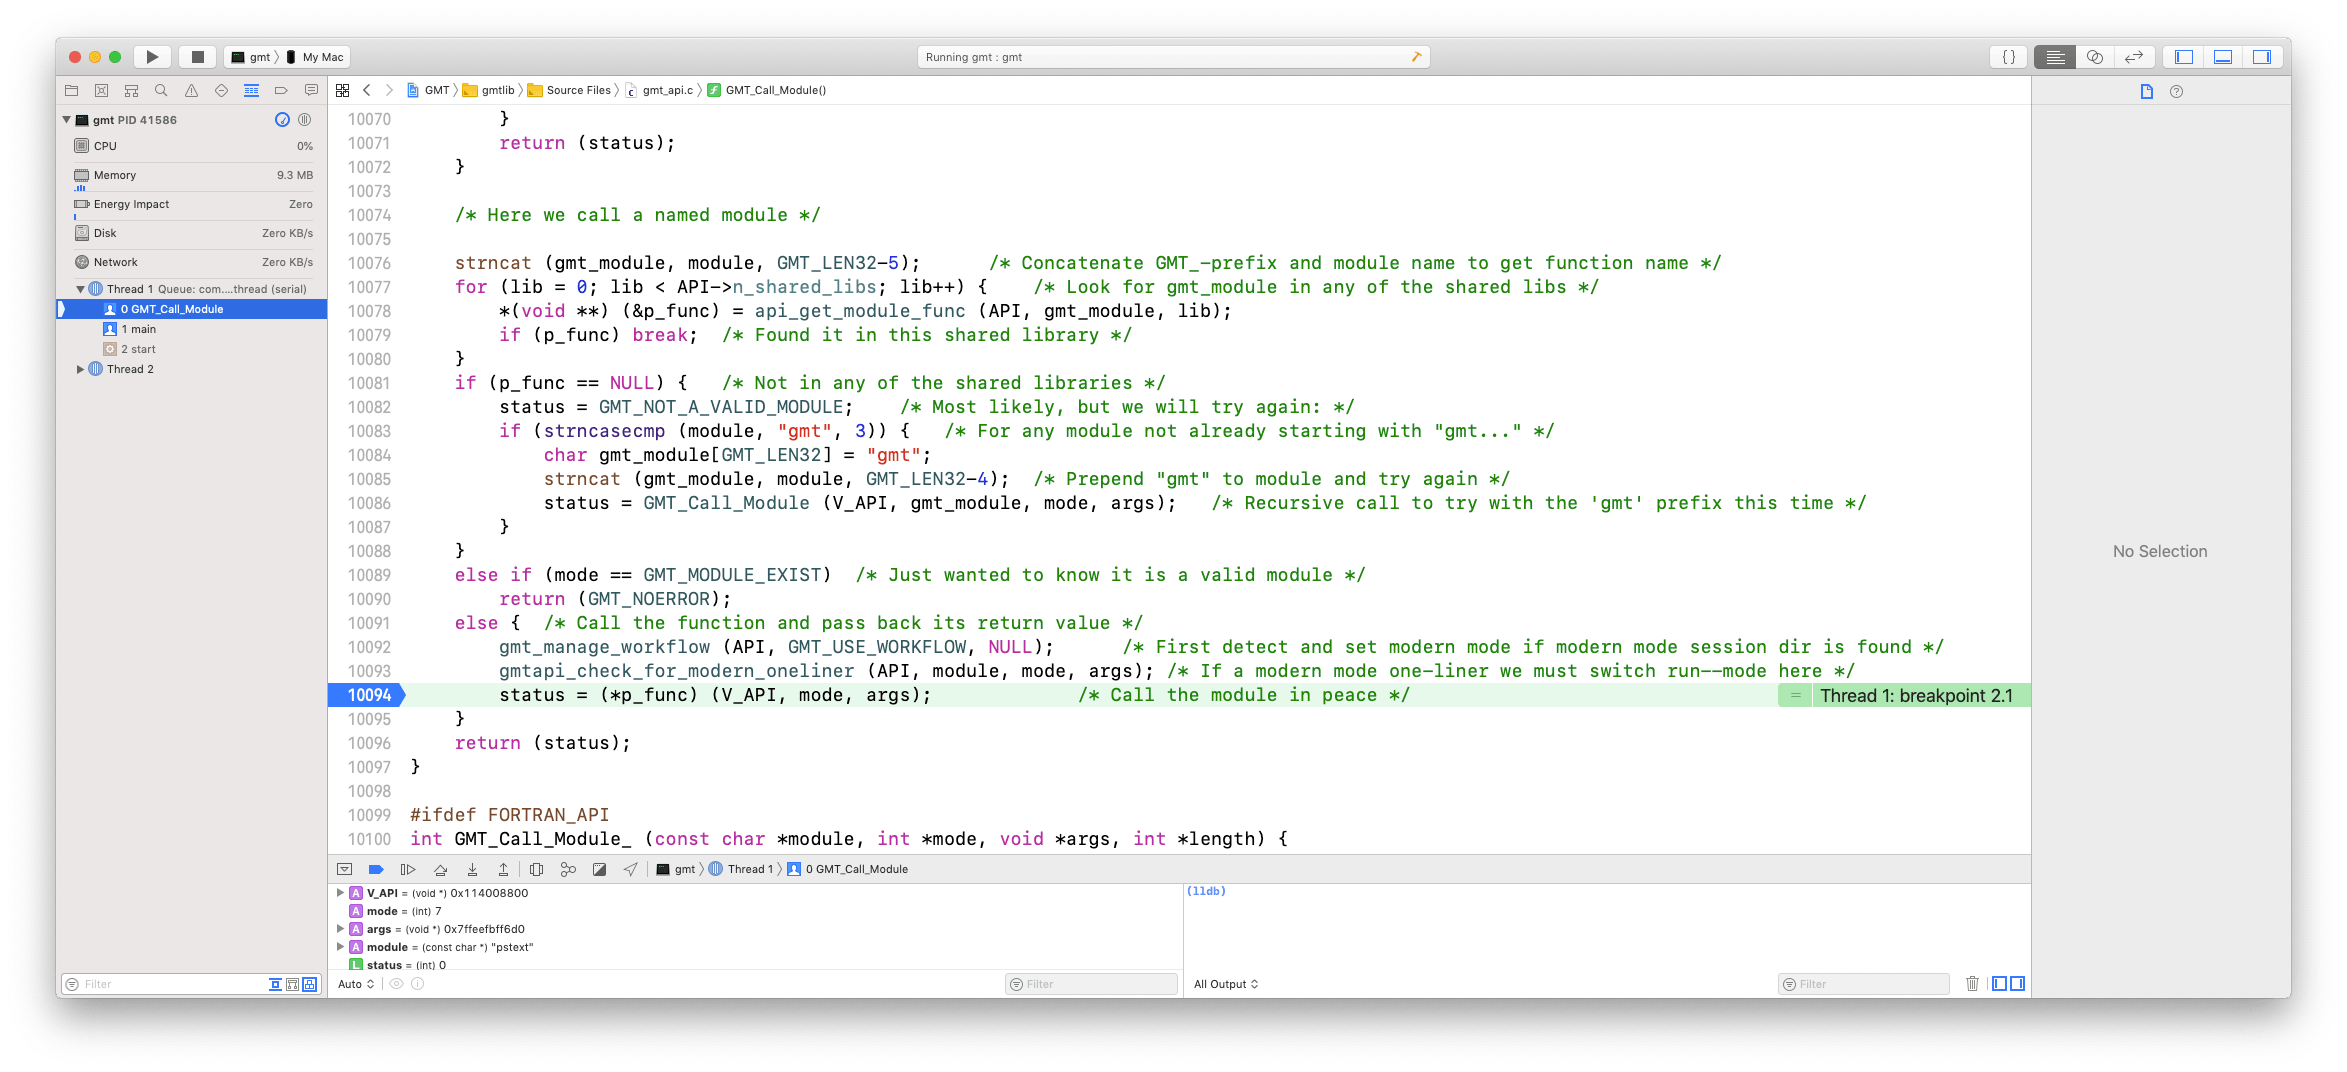
Click the step-into button and find yourself at the first executable line of code in GMT_pstext, the underlying C function at the heart of the pstext module. You can now step your way down the code, using step-over to avoid going into the details of GMT sub-functions (or step-into it if that is the problem), set stop points and push pause-play to advance to the next stop point, examine variables, and so on.