9. Including GMT Graphics into your Documents
Now that you made some nice graphics with GMT, it is time to add them to a document, an article, a report, your dissertation, a poster, a web page, or a presentation. Of course, you could try the old-fashioned scissors and glue stick. More likely, you want to incorporate your graphics electronically into the document. Depending on the application, it is best to set your GMT script to produce the most suitable format, such as Encapsulated PostScript (EPS), Portable Document Format (PDF), or some raster format (e.g., JPEG, PNG, or TIFF) in order to incorporate them into the document.
When creating a document intended for printing (article, dissertation, or poster) it is best to preserve the scalable vector characteristics of the default PDF file. Modern programs will often allow the inclusion of PDF files. That way, the sharpness of lines and fonts will be preserved and can be scaled up or down as required.
When the aim is to display the graphics on a computer screen or present it using a projector, it is wise to select a raster format. Although applications like PowerPoint can convert PDF to a ratser for you, you can best take the conversion into your own hands for the best results.
Using GMT modern mode you simply select the format most suitable for your purpuse when running begin or figure.
The remainder of this Chapter will show how to include GMT classicly produced PostScript graphics into documents and how to achieve the best quality results.
9.1. Making GMT Encapsulated PostScript Files
GMT classic mode produces freeform PostScript files. Note that a freeform
PostScript file may contain special operators (such as
Setpagedevice) that is specific to printers (e.g., selection of
paper tray). Some previewers may not
understand these valid instructions and may fail to image the file.
Also, embedding freeform PostScript with such instructions in it into
a larger document can cause printing to fail. While you could choose
another viewer (we recommend ghostview) to view single plots
prepared by GMT, it is generally wiser to convert PostScript to EPS
output when you are creating a plot intended for inclusion into a larger
document. Some programs (and some publishers as well) do not allow the
use of instructions like Setpagedevice as part of embedded graphics.
An EPS file that is to be placed into another document needs to have correct bounding box parameters. These are found in the PostScript Document Comment %%BoundingBox. Applications that generate EPS files should set these parameters correctly. Because GMTmakes the PostScript files on the fly, often with several overlays, it is not possible to do so accurately. Therefore, if you need and EPS version with a “tight” BoundingBox you need to post-process your PostScript file. There are several ways in which this can be accomplished.
Programs such as Adobe Illustrator, Aldus Freehand, and Corel Draw will allow you to edit the BoundingBox graphically.
A command-line alternative is to use freely-available program epstool from the makers of Aladdin ghostscript. Running
epstool -c -b myplot.ps
should give a tight BoundingBox; epstool assumes the plot is page size and not a huge poster.
Another option is to use ps2epsi which also comes with the ghostscript package. Running
ps2epsi myplot.ps myplot.eps
should also do the trick. The downside is that this program adds an “image” of the plot in the preamble of the EPS file, thus increasing the file size significantly. This image is a rough rendering of your PostScript graphics that some programs will show on screen while you are editing your document. This image is basically a placeholder for the PostScript graphics that will actually be printed.
However, the preferred option is to use the GMT utility psconvert. Its -A option will figure out the tightest BoundingBox, again using ghostscript in the background. For example, running
gmt psconvert -A -Te myplot.ps
will convert the PostScript file
myplot.psinto an encapsulated PostScript filemyplot.epswhich is exactly cropped to the tightest possible BoundingBox.
If you do not want to modify your illustration but just include it in a text document: many word processors (such as Microsoft Word or Apple Pages) will let you include a PostScript file that you may place but not edit. Newer versions of those programs also allow you to include PDF versions of your graphics. Except for Pages, you will not be able to view the EPS figure on-screen, but it will print correctly.
9.2. Converting GMT PostScript to PDF or raster images
Since Adobe’s PDF (Portable Document Format) seems to have become the de facto standard for vector graphics, you are often well off converting GMT produced PostScript files to PDF. Being both vector formats (i.e., they basically describe all objects, text and graphics as lines and curves), such conversion sounds awfully straightforward and not worth a full section in this document. But experience has shown differently, since most converters cut corners by using the same tool (Aladdin’s ghostscript) with basic default options that are not devised to produce the best quality PDF files.
For some applications it is practical or even essential that you convert your PostScript file into a raster format, such as GIF (Graphics Interchange Format), TIFF (Tagged Image File Format), PNG (Portable Network Graphics), or JPEG (Joint Photographic Experts Group). A web page is better served with a raster image that will immediately show on a web browser, than with a PostScript file that needs to be downloaded to view, despite the better printing quality of the PostScript image. A less obvious reason to convert your image to a raster format is to by-pass PowerPoint’s rendering engine in case you want to embed the image into a presentation.
The are a number of programs that will convert PostScript files to PDF or raster formats, like Aladdin’s pstopdf, pbmplus’ pstoimg, or GraphicsMagick’s and ImageMagick’s convert, most of which run ghostscript behind the scenes. The same is true for viewers like ghostview and Apple’s Preview. So a lot of the times when people report that their PostScript plot does not look right but prints fine, it is the way ghostscript is used with its most basic settings that is to blame.
9.2.1. When converting or viewing PostScript goes awry
Here are some notorious pitfalls with ghostscript (and other rendering programs for that matter).
- Rendering.
When you are converting to a raster format, make sure you use a high enough resolution so that the pixels do not show when it is enlarged onto a screen or using a projector. The right choice of resolution depends on the application, but do not feel limited to the default 72 dpi (dots-per-inch) that is offered by most converters.
- Image compression.
There are lossy and non-lossy compressions. A compression algorithm is called “lossy” when information is lost in the conversion: there is no way back to get the full original. The effect can be seen when there are sharp color transitions in your image: the edges will get blurry in order to allow a more efficient compression. JPEG uses a lossy compression, PNG is non-lossy, and TIFF generally does not use compression at all. We therefore recommend you convert to PNG if you need to rasterize your plot, and leave JPEG to photographs.
- Embedded image compression.
When your GMT plot includes objects produced by grdimage, image or legend, they are seen as “images”. The default options of ghostscript will use a lossy compression (similar to JPEG) on those images when converting them to PDF objects. This can be avoided, however, by inhibiting the compression altogether, or using the non-lossy flate compression, similar to the one used in the old compress program. This compression is fully reversible, so that your image does not suffer any loss.
- Auto-rotation.
The ghostscript engine has the annoying habit to automatically rotate an image produced with portrait orientation (using the -P option) so that the height is always larger than the width. So if you have an image that was printed in portrait mode but happens to have a width larger than height (for example a global map), it would suddenly get rotated. Again, this function needs to be switched off. Apple’s Preview uses the ghostscript engine and suffers from the same annoying habit. Oddly enough, ghostscript does not force landscape plots to be “horizontal”.
- Anti-aliasing.
This is not something to worry about when converting to PDF, but certainly when producing raster images (discussed below). Anti-aliasing in this context means that the rendering tries to avoid aliasing, for example, sampling only the blacks in a black-and-white hachure. It does so by first oversampling the image and then using “gray-shades” when a target pixel is only partially white or black.
Clearly, this can lead to some unwanted results. First, all edges and lines get blurry and second, the assumption of a white background causes the gray shades to stand out when transferring the image to background with a different color (like the popular sleep-inducing blue in PowerPoint presentations). A more surprising effect of anti-aliasing is that the seams between tiles that make up the land mask when using coast will become visible. The anti-aliasing somehow decides to blur the edges of all polygons, even when they are seamlessly connected to other polygons.
It is therefore wise to overrule the default anti-aliasing option and over-sample the image yourself by choosing a higher resolution.
- Including fonts.
When you are producing print-ready copy to publishers, they will often (and justifiably) ask that you include all fonts in your PDF document. Again, ghostscript (and all converters relying on that engine) will not do so by default.
9.2.2. Using psconvert
The remedy to all the problems mentioned in the previous section is readily available to you in the form of the GMT utility psconvert. It is designed to provide the best quality PDF and raster files using ghostscript as a rendering engine. The program psconvert avoids anti-aliasing and lossy compression techniques that are default to ghostscript and includes the fonts into the resulting PDF file to ensure portability. By default the fonts are rendered at 720 dots-per-inch in a PDF file and images are sampled to 300 dpi, but that can be changed with the -E option. Simply run
gmt psconvert -A -P -Tf *.ps
to convert all PostScript files to PDF while cropping it to the smallest possible BoundingBox. Or use the -Tg option to convert your files to PNG.
The -P option of psconvert may also come in handy. When you have not supplied the -P option in your first GMT plot command, your plot will be in Landscape mode. That means that the plot will be rotated 90° (anti-clockwise) to fit on a Portrait mode page when coming out of the printer. The -P option of psconvert will undo that rotation, so that you do not have to do so within your document. This will only affect Landscape plots; Portrait plots will not be rotated. We should note that the -A option in psconvert has many modifiers that can be used to control background color, framing, padding, and overall scaling of the result.
9.3. Examples
9.3.1. GMT graphics in LaTeX
To add the graphics into a LaTeX document we use the
\includegraphics command supplied by the package. In the preamble of
your LaTeX document you will need to include the line
\usepackage{graphicx}
The inclusion of the graphics will probably be inside a floating figure environment; something like this
\begin{figure}
   \includegraphics{myplot}
   \caption{This is my first plot in \LaTeX.}
   \label{fig:myplot}
\end{figure}
Note that the \includegraphics command does not require you to add
the suffix .pdf to the file name. If you run pdflatex, it will
look automatically for myplot.pdf. If you run latex, it will use myplot.eps instead.
You can scale your plot using the options width=, height=, or
scale=. In addition, if your original graphics was produced in
Landscape mode (i.e., you did not use GMT’s -P option: not
while plotting, nor in psconvert),
you will need to rotate the plot as well. For example,
\includegraphics[angle=-90,width=0.8\textwidth]{myplot}
will rotate the image 90° clockwise and scale it such that its width (after rotation) will be 80% of the width of the text column.
9.3.2. GMT graphics in PowerPoint
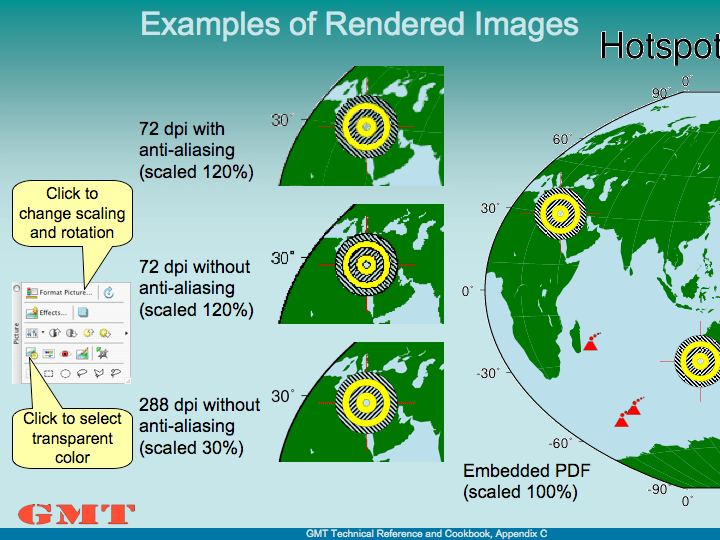
Examples of rendered images in a PowerPoint presentation
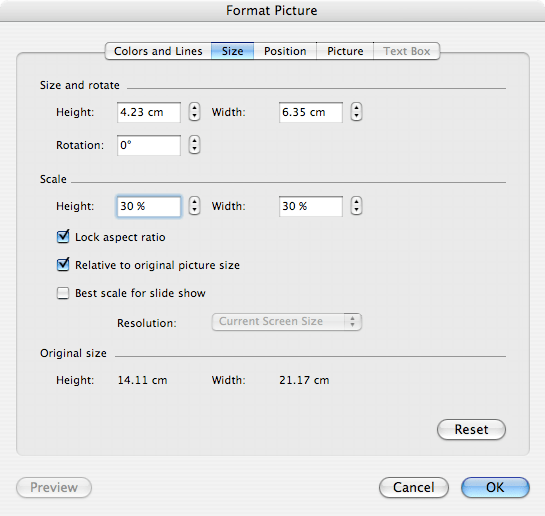
PowerPoint’s Format Picture dialogue to set scale and rotation.
In Figure Rendered images we have attempted to include Example (20) Custom plot symbols into a PowerPoint presentation. First the PostScript file was converted to PDF (using psconvert), then loaded into PowerPoint and the white background color was made transparent using the formatting toolbar (shown on the left side of Figure Rendered images). Clearly, when we let PowerPoint do the rendering, we do not get the best result:
The anti-aliasing causes the tiles that make up the land to stand out. This is because the anti-aliasing algorithm blurs all edges, even when the tiles join seamlessly.
The background color was assumed to be white, hence the text is “smoothed” using gray shades. Instead, shades of blue which would be appropriate for the background we are using.
On the central column of Figure Rendered images we have included PNG versions of a portion of the same example. This shows the workings of anti-aliasing and different resolutions. All samples were obtained with convert. The one on the top uses all default settings, resulting in an anti-aliased image at 72 dpi resolution (very much like the PDF included directly into PowerPoint).
Just switching anti-aliasing off (middle) is clearly not an option either. It is true that we got rid of the gray blurring and the seams between the tiles, but without anti-aliasing the image becomes very blocky. The solution is to render the image at a higher resolution (e.g., 300 dpi) without anti-aliasing and then shrink the image to the appropriate size (bottom of the central column in Figure Rendered images). The scaling, rotation as well as the selection of the transparent color can be accomplished through the “Formatting” tool bar and the “Format Picture” dialogue box of PowerPoint (Figure PowerPoint dialogue box), which can be found by double clicking the included image (or selecting and right-clicking or control-clicking on a one-button mouse).
9.4. Concluding remarks
These examples do not constitute endorsements of the products mentioned above; they only represent our limited experience with adding PostScript to various types of documents. For other solutions and further help, please post messages to the GMT user forum.