grd2xyz
Convert grid to data table
Synopsis
gmt grd2xyz ingrid [ -C[section/]master|cpt|color\(_1\),color\(_2\)[,color\(_3\),…][+h[hinge]][+idz][+u|Uunit][+sfname] ] [ -F[f|i] ] [ -L[c|r|x|y]value ] [ -Rregion ] [ -V[level] ] [ -T[a|b][base] ] [ -W[a[+uunit]|weight] ] [ -Z[flags] ] [ -bobinary ] [ -dnodata[+ccol] ] [ -fflags ] [ -ho[n] ] [ -oflags ] [ -qoflags ] [ -sflags ] [ --PAR=value ]
Note: No space is allowed between the option flag and the associated arguments.
Description
grd2xyz reads one or more binary 2-D grid files and writes out xyz-triplets in ASCII [or binary] format to standard output. Modify the precision of the ASCII output format by editing the FORMAT_FLOAT_OUT parameter in your gmt.conf file or use --FORMAT_FLOAT_OUT=format on the command line, or choose binary output using single or double precision storage. As an option you may output z-values without the (x, y) coordinates (see -Z below) or you can save the grid in the STL format for 3-D printers with -T. Also, by giving a CPT via -C we will add r, g, b, a columns to the output based on z values.
Required Arguments
ingrid[=ID|?varname][+bband][+ddivisor][+ninvalid][+ooffset][+sscale]
Optionally, append =ID for reading a specific file format [Default is =nf] or ?varname for a specific netCDF variable [Default is the first 2-D grid found by GMT]. The following modifiers are supported:
+b - Select a band [Default is 0].
+d - Divide data values by the given divisor [Default is 1].
+n - Replace data values matching invalid with NaN.
+o - Offset data values by the given offset [Default is 0].
+s - Scale data values by the given scale [Default is 1].
Note: Any offset is added after any scaling.
Optional Arguments
- -C[section/]master|cpt|color\(_1\),color\(_2\)[,color\(_3\),…][+h[hinge]][+idz][+u|Uunit][+sfname]
Determine the color components based on the z values. Append name of a master CPT, an input CPT file or a comma-separated list of colors from which to build a CPT. If no argument is given then under modern mode we select the current CPT, if it is available. Generally, the input can be many things:
A standard GMT master CPT file, e.g., earth (see Of Colors and Color Legends) and can be either addressed by master or section/master (without any .cpt extension).
File name of already custom-made cpt file (e.g, my_colors.cpt).
Build a linear continuous CPT from color\(_1\),color\(_2\)[,color\(_3\),…] automatically, where z starts at 0 and is incremented by one for each color. In this case, color\(_i\) can be a r/g/b (e.g., 255/100/75), h-s-v triplet (e.g., 180-0.8-1), a c/m/y/k quadruple (e.g., 80/50/40/30), an HTML hexadecimal color (e.g. #aabbcc), or a color name. No spaces between commas are allowed.
A few modifiers pertains to hinges and units:
+h - If given a master CPT with soft hinges then you can enable the hinge at data value hinge [0], whereas for hard-hinge CPTs you can adjust the location of the hinge [0] but not disable it.
+i - Append increment dz to quantize the grid range [Default uses the exact grid range].
+s - Append fname to save the finalized CPT in a disk file. This is useful when the CPT is generated automatically, but if used, must be at the end of the -C option.
+u - For any other master CPT, you may convert their z-values from other distance Units to meter by appending the original unit code.
+U - Likewise, you may convert their z-values from meter to other Units by appending the desired unit code.
Note: We append four extra output columns at the end of the output records. These are the red, green, and blue components color components (all in 0-255 range) and the transparency value (0-100% range, with 0 meaning opaque). If the color table is a gray table, then we output gray (0-255) instead of three identical components.
- -F[f|i]
Replace the x- and y-coordinates on output with the corresponding column and row numbers. These start at 0 (C-style counting); append f to start at 1 (FORTRAN-style counting). Alternatively, append i to write just the two columns index and z, where index is the 1-D indexing that GMT uses when referring to grid nodes.
- -Lc|r|x|y]value
Limit the output of records to a single row or column. Identify the desired vector either by row or column number (via directives c or r), or by the constant x or y value (via directives x or y). If your selection is outside the valid range then no output will result and a warning is issued. Note: For directives x and y we find the nearest column or row, respectively.
- -Rxmin/xmax/ymin/ymax[+r][+uunit]
Specify the region of interest. Using the -R option will select a subsection of the grid. If this subsection exceeds the boundaries of the grid, only the common region will be output. (See full description) (See technical reference).
- -T[a|b][base]
Write STL triangulation for 3-D printing to standard output. By default (or via -Ta) we write an STL ASCII file. Append b to instead write the STL binary (little-endian) format. For more information on STL, see the STL overview on Wikipedia. Note: All coordinates are adjusted so that xmin = ymin = zmin = 0. For other adjustments, see grdedit, grdproject and grdmath. Optionally, append a lower base other than the grid’s minimum value [Default]. Note: The grid must be free of NaN values. If your grid contains NaNs then we automatically replace these with the minimum value in the grid; use grdmath to pre-process the grid if you wish to select another value.
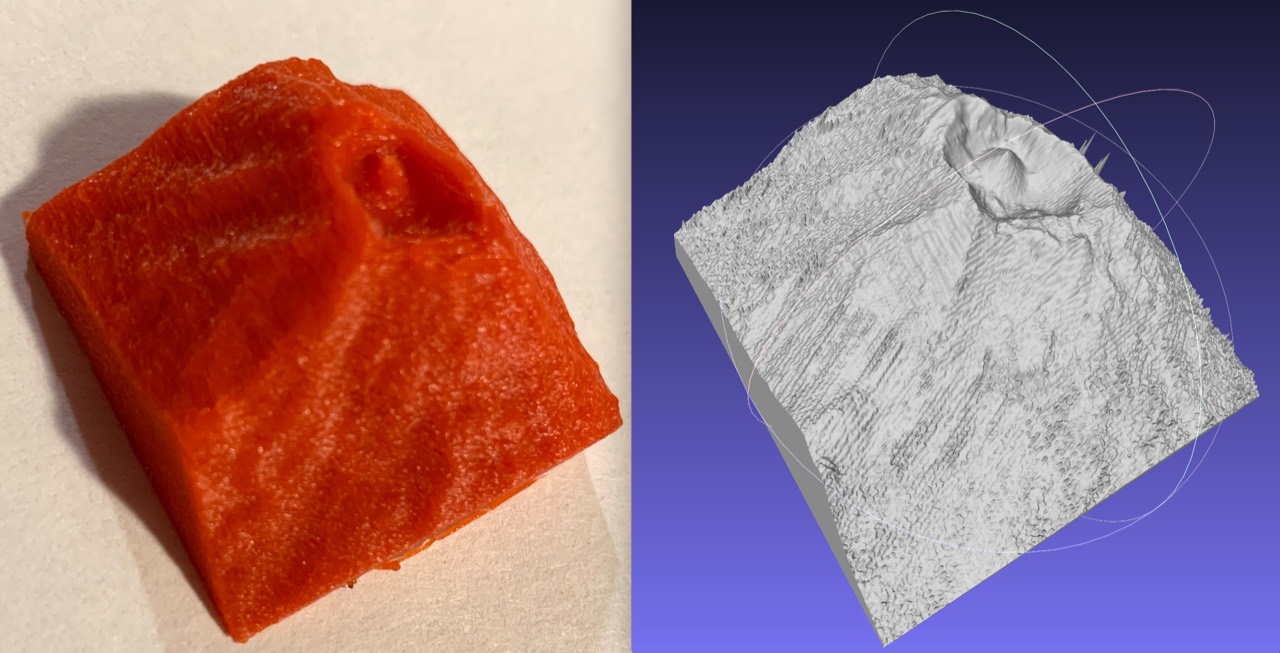
3-D print of Vailulu’u crater multibeam data (2006, R/V Kilo Moana off Samoa) via a GMT STL file. Original multibeam data processed with MB-System seen on the right. Photos courtesy of Jasper Konter, U of Hawaii at Manoa.
- -V[level]
Select verbosity level [w]. (See full description) (See technical reference).
- -W[a[+uunit]|weight]
Write out x, y, z, w, where w is the supplied weight (or 1 if not supplied) [Default writes x, y, z only]. Choose -Wa to compute weights equal to the area each node represents. For Cartesian grids this is simply the product of the x and y increments (except for gridline-registered grids at all sides [half] and corners [quarter]). For geographic grids we default to a length unit of k (hence area is in km2). Change this by appending +uunit (see Units). For such grids, the area varies with latitude and also sees special cases for gridline-registered layouts at sides, corners, and poles.
- -Z[flags]
Write a 1-column ASCII [or binary] table. Output will be organized according to the specified ordering convention contained in flags. If data should be written by rows, make flags start with T (op) if first row is y = ymax or B (ottom) if first row is y = ymin. Then, append L or R to indicate that first element should start at left or right end of row. Likewise for column formats: start with L or R to position first column, and then append T or B to position first element in a row. For gridline registered grids: If grid is periodic in x but the written data should not contain the (redundant) column at x = xmax, append x. For grid periodic in y, skip writing the redundant row at y = ymax by appending y. If the byte-order needs to be swapped, append w. Select one of several data types (all binary except a):
a ASCII representation of a single item per record
c int8_t, signed 1-byte character
u uint8_t, unsigned 1-byte character
h int16_t, short 2-byte integer
H uint16_t, unsigned short 2-byte integer
i int32_t, 4-byte integer
I uint32_t, unsigned 4-byte integer
l int64_t, long (8-byte) integer
L uint64_t, unsigned long (8-byte) integer
f 4-byte floating point single precision
d 8-byte floating point double precision
Default format is scanline orientation of ASCII numbers: -ZTLa.
- -borecord[+b|l] (more …)
Select native binary format for table output. [Default is 3]. This option only applies to xyz output; see -Z for z table output.
- -d[i|o][+ccol]nodata (more …)
Replace input columns that equal nodata with NaN and do the reverse on output.
- -f[i|o]colinfo (more …)
Specify data types of input and/or output columns. See also TIME COORDINATES below. -h Output 1 header record based on information in the first grid file header. Ignored if binary output is selected. [Default is no header].
- -h[i|o][n][+c][+d][+msegheader][+rremark][+ttitle] (more …)
Skip or produce header record(s).
- -ocols[+l][+ddivisor][+sscale|d|k][+ooffset][,…][,t[word]] (more …)
Select output columns and transformations (0 is first column, t is trailing text, append word to write one word only).
- -qo[~]rows|limits[+ccol][+a|t|s] (more …)
Select output rows or data limit(s) [default is all rows].
- -s[cols][+a][+r] (more …)
Set handling of NaN records for output.
- -^ or just -
Print a short message about the syntax of the command, then exit (Note: on Windows just use -).
- -+ or just +
Print an extensive usage (help) message, including the explanation of any module-specific option (but not the GMT common options), then exit.
- -? or no arguments
Print a complete usage (help) message, including the explanation of all options, then exit.
- --PAR=value
Temporarily override a GMT default setting; repeatable. See gmt.conf for parameters.
Units
For map distance unit, append unit d for arc degree, m for arc minute, and s for arc second, or e for meter [Default unless stated otherwise], f for foot, k for km, M for statute mile, n for nautical mile, and u for US survey foot. By default we compute such distances using a spherical approximation with great circles (-jg) using the authalic radius (see PROJ_MEAN_RADIUS). You can use -jf to perform “Flat Earth” calculations (quicker but less accurate) or -je to perform exact geodesic calculations (slower but more accurate; see PROJ_GEODESIC for method used).
ASCII Format Precision
The ASCII output formats of numerical data are controlled by parameters in your gmt.conf file. Longitude and latitude are formatted according to FORMAT_GEO_OUT, absolute time is under the control of FORMAT_DATE_OUT and FORMAT_CLOCK_OUT, whereas general floating point values are formatted according to FORMAT_FLOAT_OUT. Be aware that the format in effect can lead to loss of precision in ASCII output, which can lead to various problems downstream. If you find the output is not written with enough precision, consider switching to binary output (-bo if available) or specify more decimals using the FORMAT_FLOAT_OUT setting.
Non-equidistant x/y Coordinates
In general, GMT modules cannot accept grids with variable x and/or y coordinates as most algorithms and plotting options expect equidistant grids. However, you can use grd2xyz to dump the original x y z triplets and then reprocess the data onto an equidistant lattice via greenspline, nearneighbor or surface, for instance.
Time Coordinates
Time coordinates in netCDF grids, be it the x, y, or z coordinate, will be recognized as such. The variable’s unit attribute is parsed to determine the unit and epoch of the time coordinate in the grid. Values are then converted to the internal time system specified by TIME_UNIT and TIME_EPOCH in the gmt.conf file or on the command line. The default output is relative time in that time system, or absolute time when using the option -f0T, -f1T, or -f2T for x, y, or z coordinate, respectively.
Row Order
The -Lr option allows you to output a specific row in the grid. Note that while a grid’s y-coordinates are positive up, internal row numbers are scanline numbers and hence positive down. Therefore, the first row (0) coincides with the largest y-value. This means that -Lr0 and -Lyymax (for the correct maximum y-value) will yield the same result. In contrast, both x and column numbers are positive to the right, with -Lc0 and -Lxxmin (for the correct minimum x-value) yielding the same output.
Examples
To edit individual values in the 2’ by 2’ remote AFR.nc file, dump the .nc to ASCII:
gmt grd2xyz @AFR.nc > AFR.xyz
To write a single precision binary file without the x, y positions from the remote file @AFR.nc file, using scanline orientation, run:
gmt grd2xyz @AFR.nc -ZTLf > AFR.b
To write out lon, lat, topo, area from the @AFR.nc file, selecting meter2 as the area unit, and where area reflects the size of each grid box, run:
gmt grd2xyz @AFR.nc -Wa+ue > AFR.txt