Debugging for Developers
GMT developers may need to run GMT in a debugger to figure out the problem reported by an issue. Often there is a bit of detective work involved to find out where a module crashes and then step carefully through that section, examining variables etc., to learn why something fails. This process depends on the particular debug tool one uses. This page will explain the steps a developer must take to build gmt so it is suitable for your debug tool and how to use that tool. Note: If the offending script is coming from PyGMT, GMT.jl, or GMT/MEX there are instructions below on how to connect your debugger to that process and have you land in the debugger when the script is run.
Xcode on macOS
Developers on macOS are most likely to want to use Xcode for this purpose. Chances are they are already using the command-line tools from Xcode (gcc, linker) anyway. To use the GUI part of Xcode you must have installed the full Xcode (you most likely did, but there are ways to only install the command-line tools, so make sure you have an Xcode icon under Applications). Xcode may change as versions change; the images below is for Xcode 10-11.
You will need to make some changes to your cmake/ConfigUserAdvanced.cmake file. Scroll down to the section that says “# Extra debugging for developers:” and uncomment the ~6 lines that has the if-test on “Xcode”. This will pass a few flags that are used when debugging via Xcode. Also uncomment the two “add_definitions” lines that contain the word “DEBUG” in it somewhere.
You will need to build GMT again. I recommend you do this in a separate build directory (I call mine xbuild, and while at it I use rbuild for “Release Builds” and dbuild for regular debug command line builds, and build for the final build for the releases). If you are in the xbuild directory, these two commands will do the build:
cmake -DCMAKE_INSTALL_PREFIX=gmt6 -DCMAKE_BUILD_TYPE=Debug -G Xcode ..
xcodebuild
After this step you can launch the Xcode application and then use the File->Open menu to open the project file xbuild/GMT.xcodeproj. After it opens it may looks something like this (click on the figure to enlarge it):
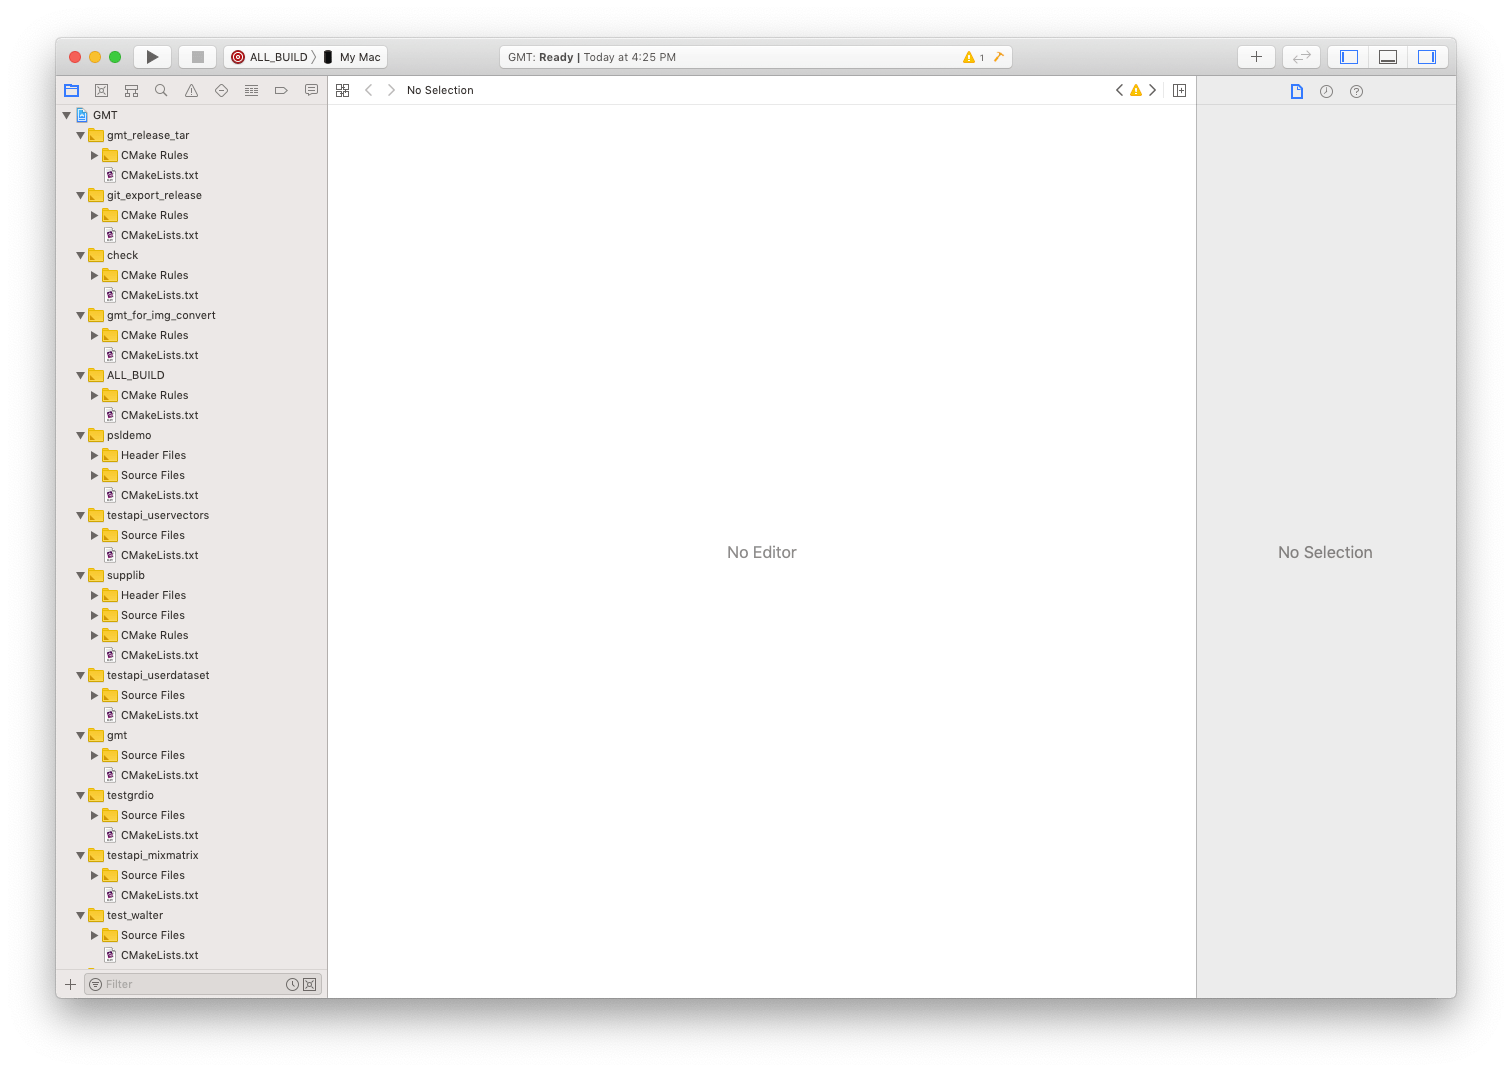
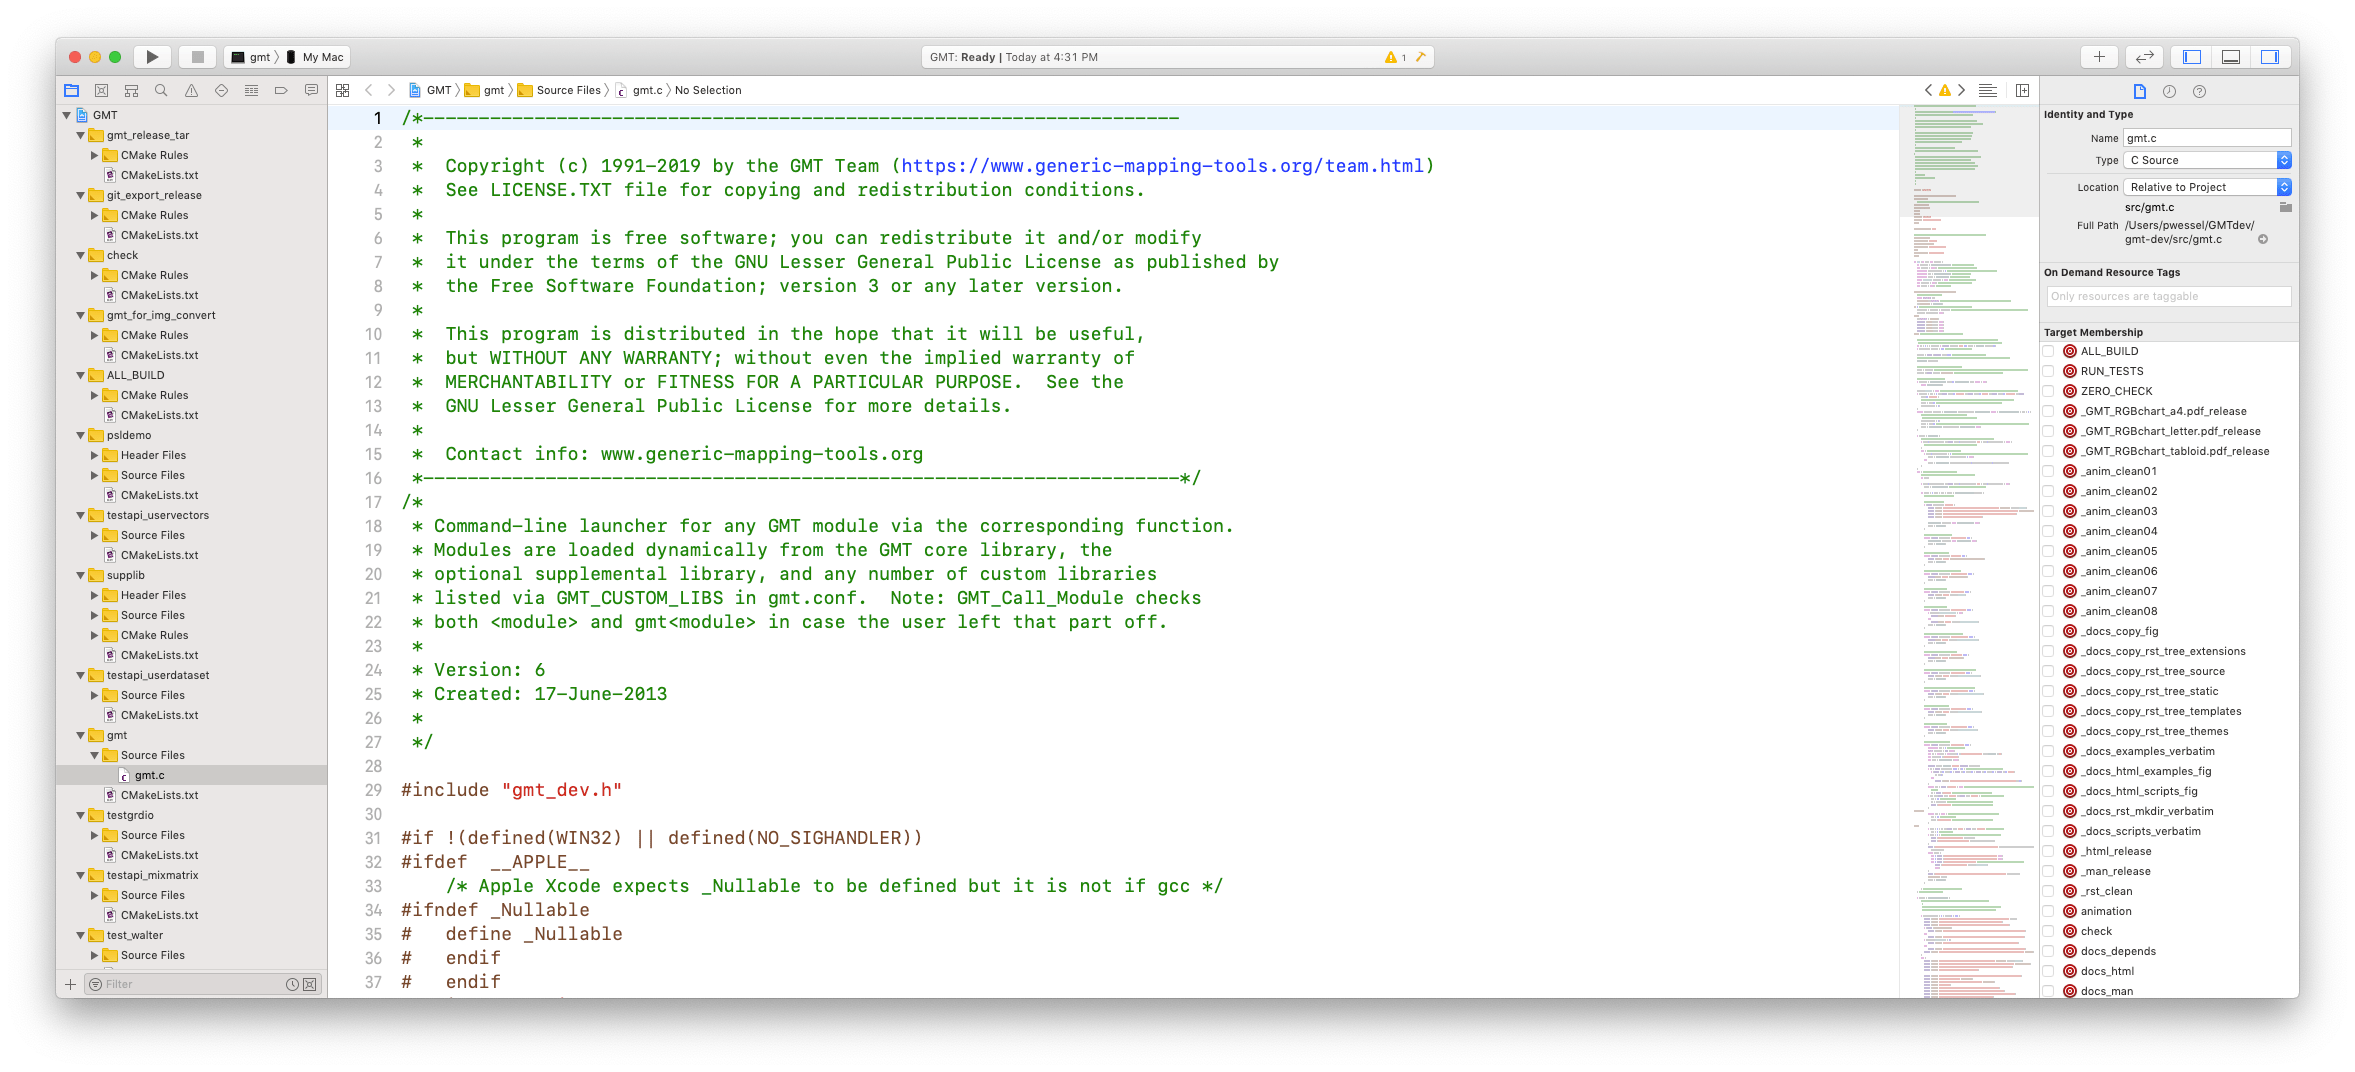
Pull down the tab that says “@ ALL_BUILD” and select “gmt” about 35 lines down, then in the left sidebar open the folder called gmt->Source Files and select gmt.c. Now you may wish to drag the window to be a bit wider so the lines don’t wrap around so much. After that step your screen may look more like this:
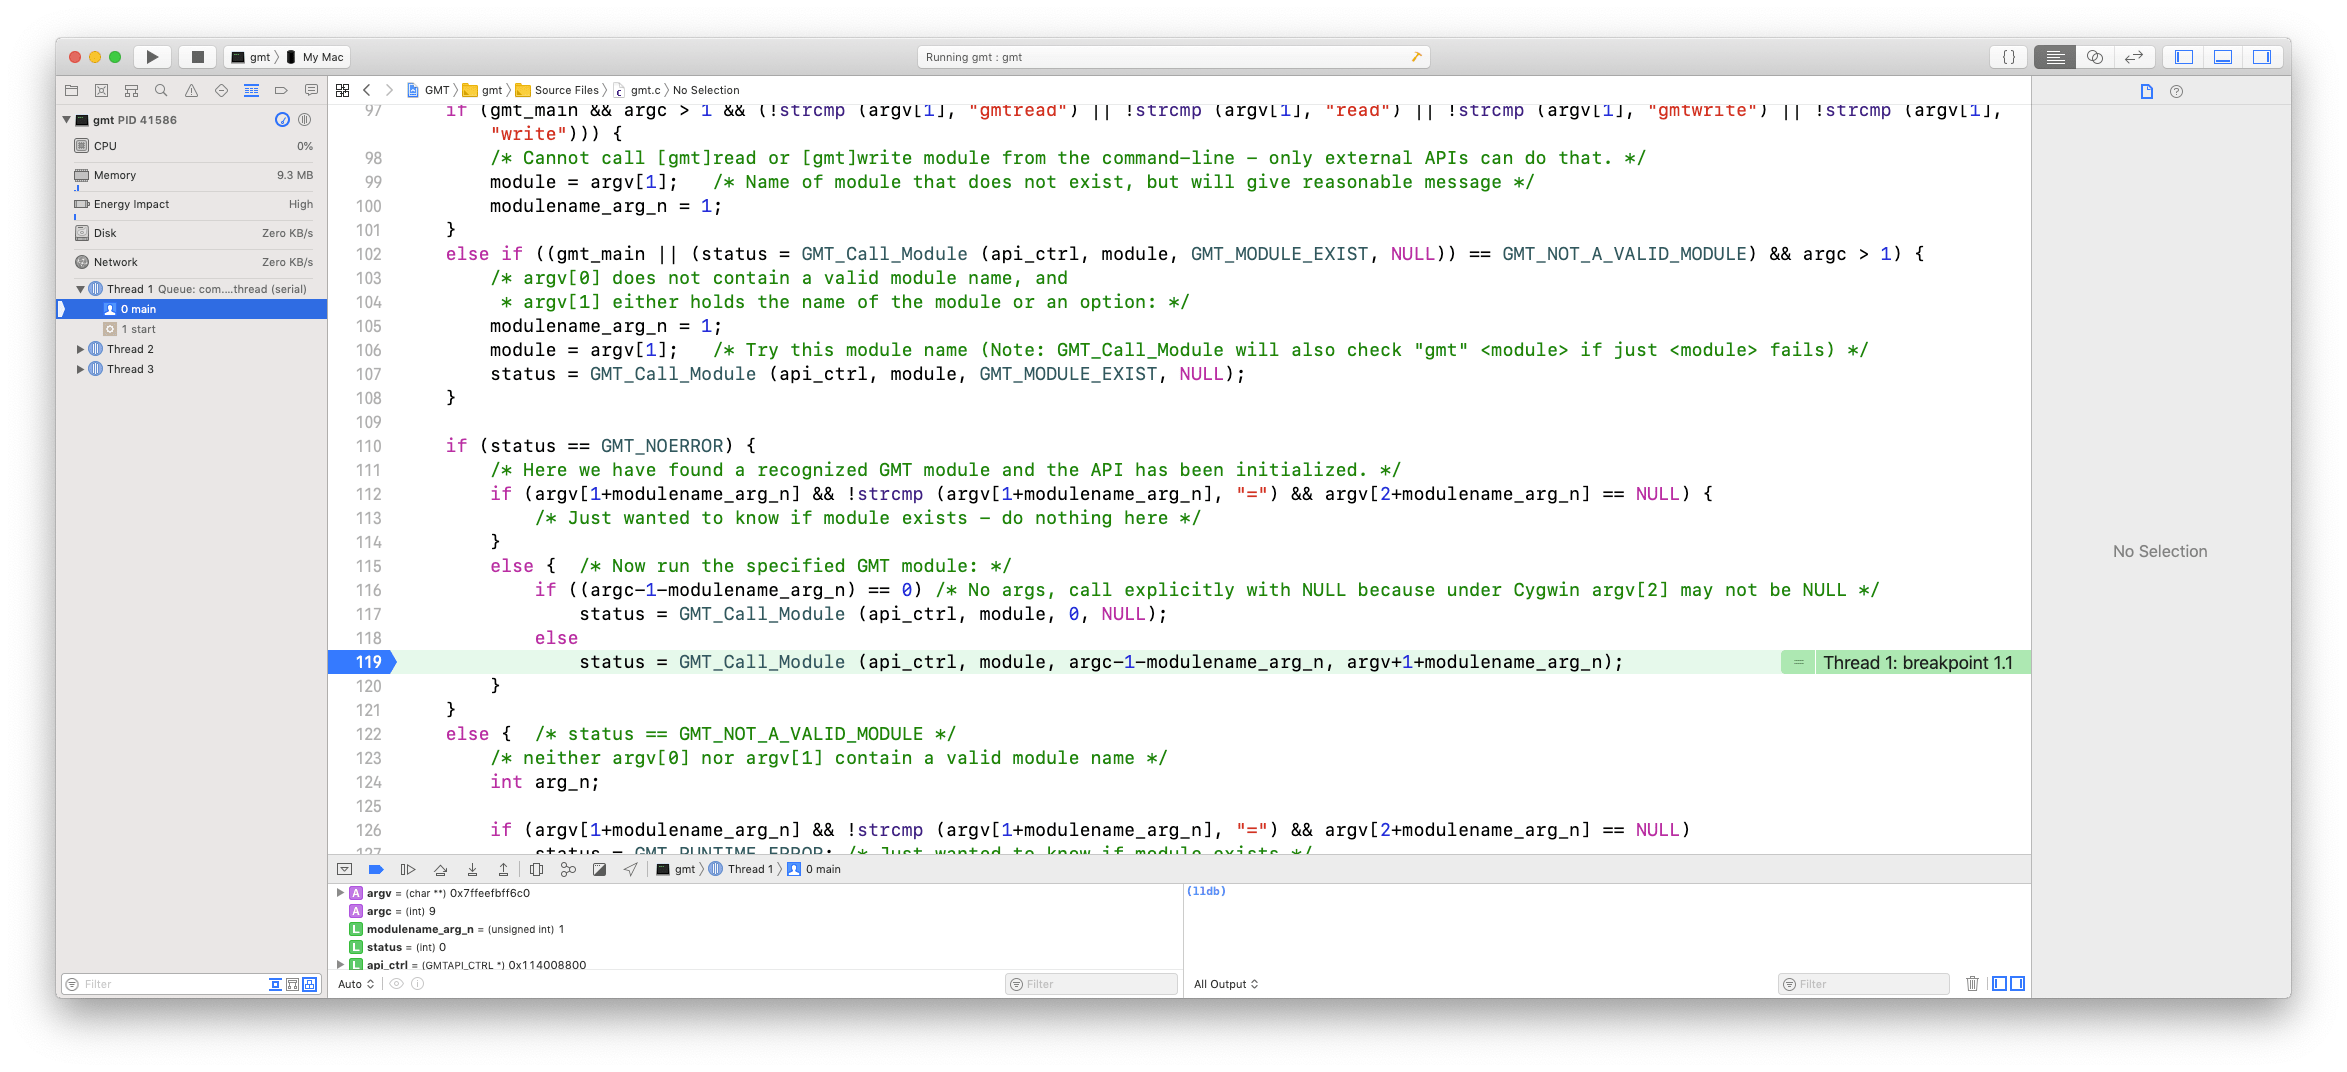
Scroll down to the part around line 119 and click the line number to place a stop point; it will add a blue fat arrow at that line:
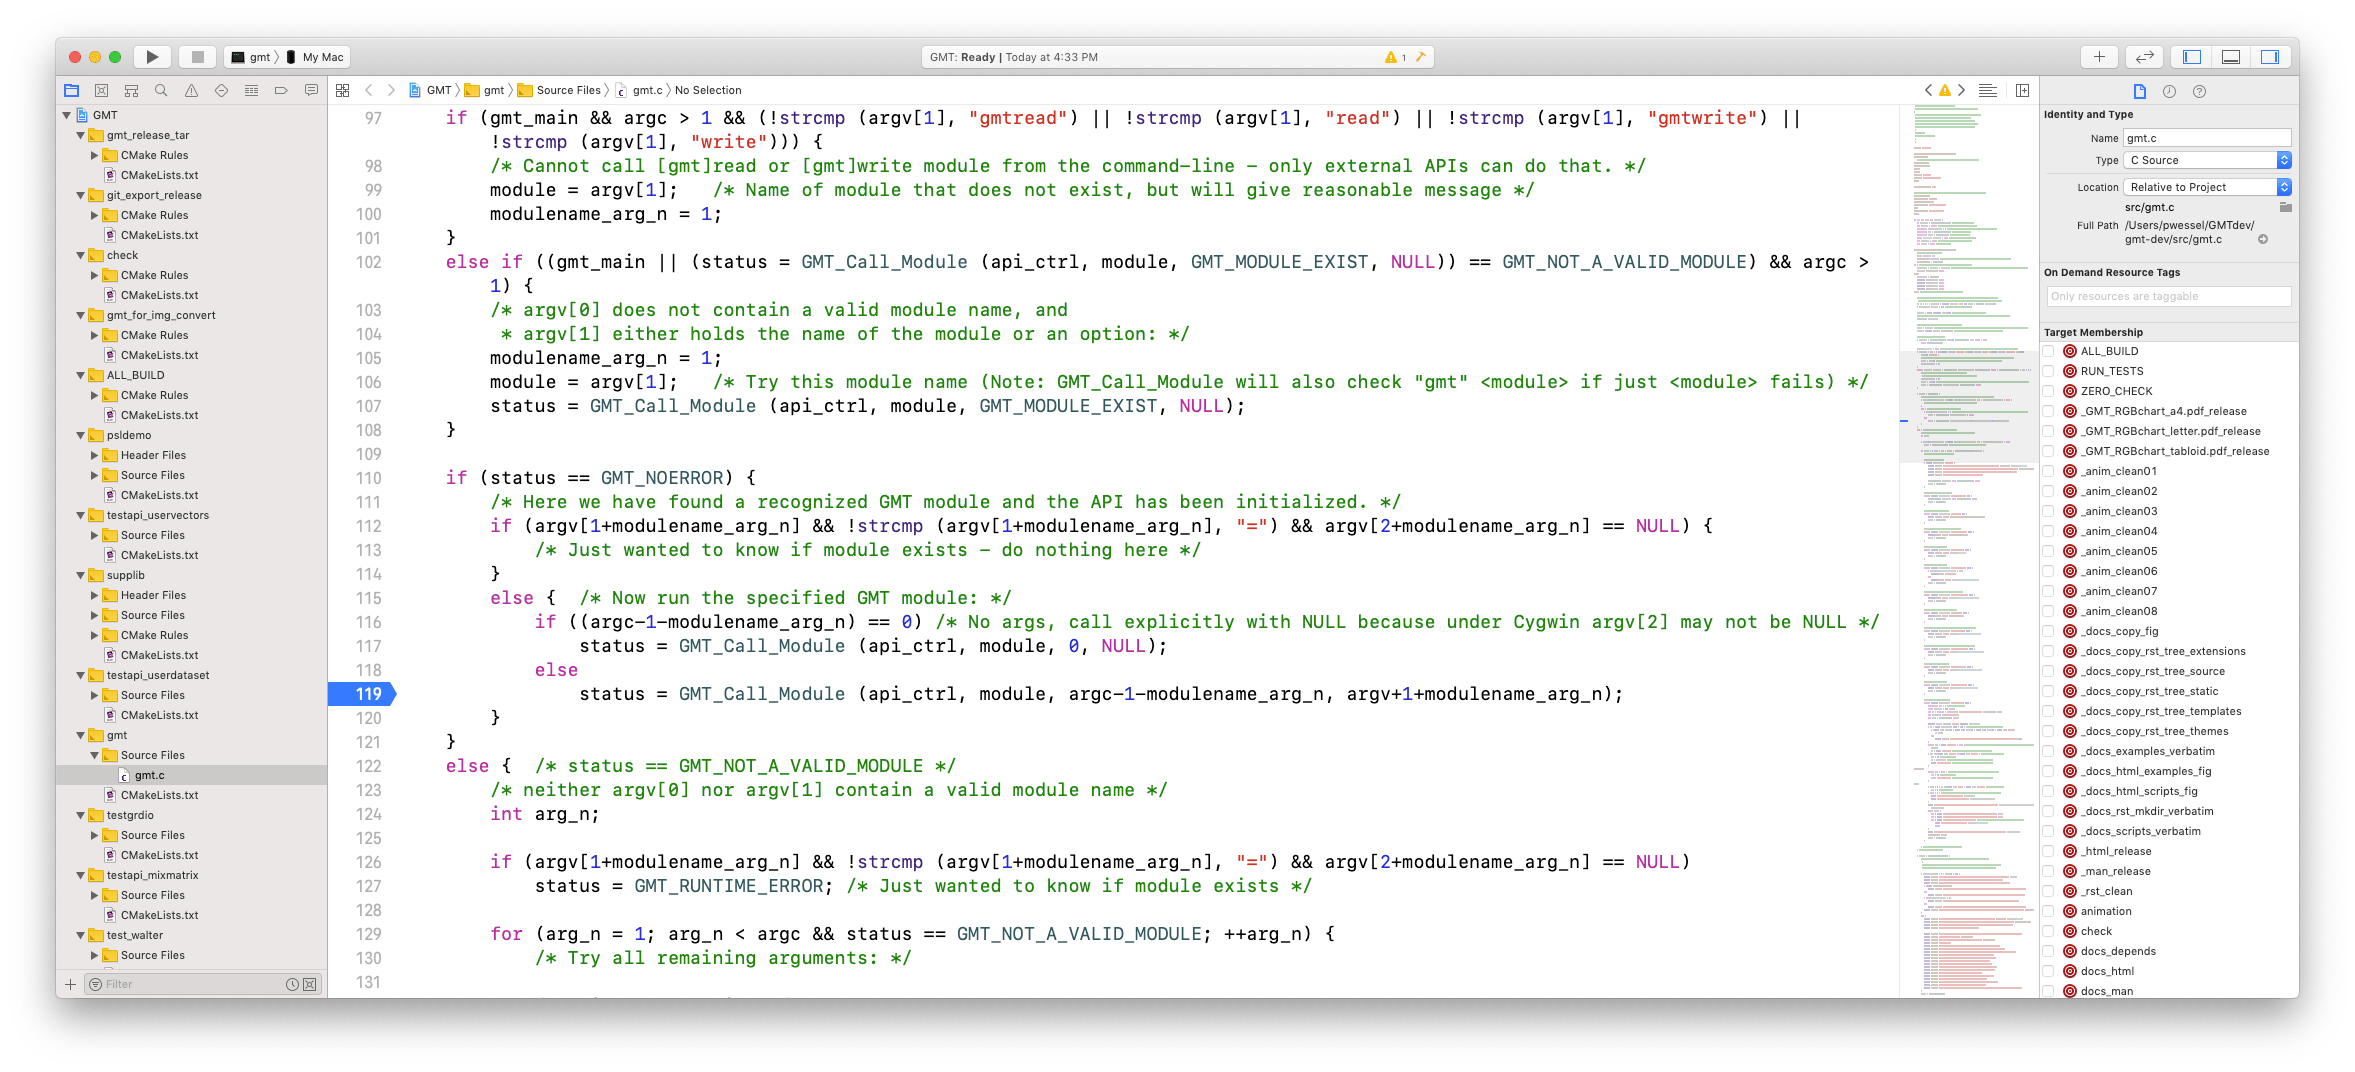
This is usually the first stop you want in Xcode. The exception would be if you are debugging gmt.c itself or you need to examine the code that creates the session via a call to GMT_Create_Session earlier in the program.
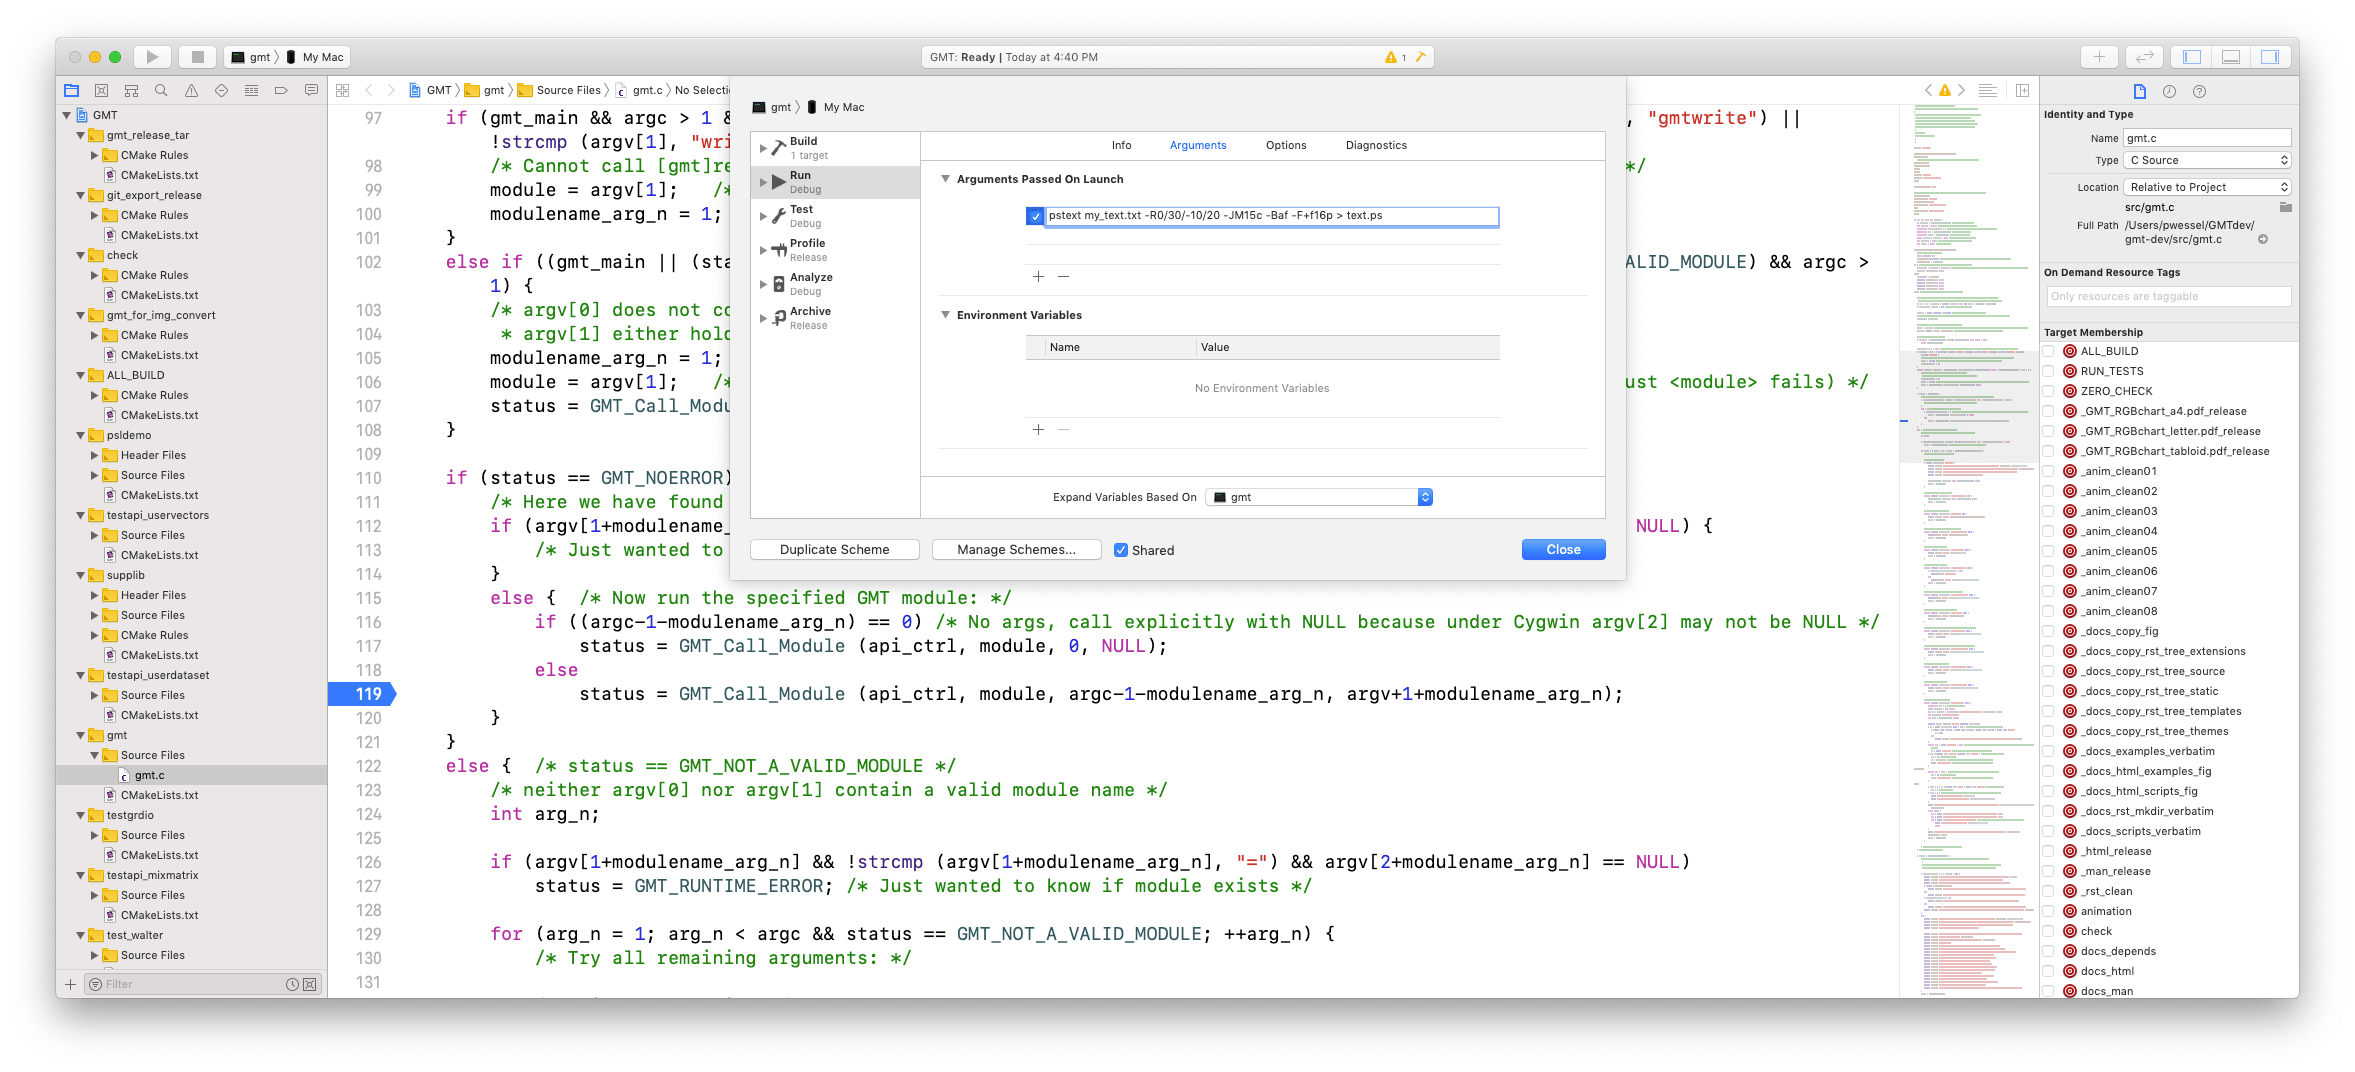
Now we need to specify the particular command we wish to debug. Let’s pretend that pstext crashes when we run the command:
gmt pstext my_text.txt -R0/30/-10/20 -JM15c -Baf -F+f16p > text.ps
Copy that command minus the initial “gmt “ part. Now pull down the menu item “Product->Scheme->Edit Scheme”, then make sure “Arguments” tab is highlighted in blue in the top table, then click the “+” symbol beneath the section that says “Arguments Passed on Launch” and paste in our command; it should result in this display:
Normally you do not need to set any “Environmental Variables”, but if you are debugging a module that calls an external program (e.g., gs, gdal_translate, etc.) then you may need to add the name PATH and place the path to that program under “Value”. Likewise, if the module needs to find a particular environmental setting like $X2SYS_HOME, then you must set those here as well.
For problems involving memory access errors (SEGV, etc.) you may need to visit the “Diagnostics” tab and set as many of the Memory Management checks as you can. For other types of errors you may need to play with the Runtime Sanitization settings, and so on. This tab looks something like this:
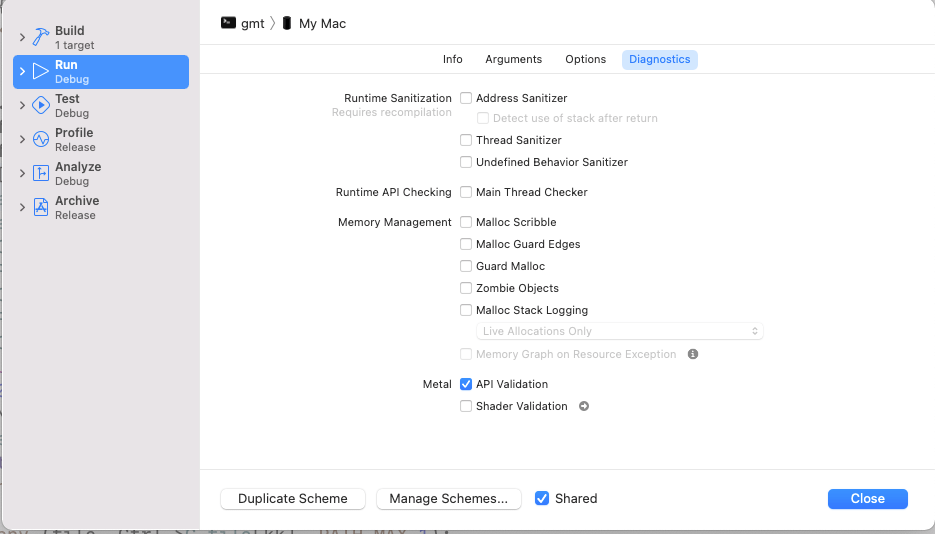
We must often make sure these are set so that Xcode will actually show the error. Experience has taught us that many crashes reported on Windows or Linux do not necessarily crash on macOS but they will in Xcode if we engage these diagnostic settings. Finally, use the “Options” tab to change the current directory where the debug session is run and inputs and outputs are read and written.
Any data files your command will read must either be placed in the xbuild/src/Debug subdirectory or you must change the command you pasted above to use the full path instead. In other words, when Xcode runs your command, your current directory becomes xbuild/src/Debug.
Click close and hit the “Play” button next to the green circle in the top left corner. It may do some building and indexing before it starts and then stops at your highlighted line, opening up a display console below the source code:
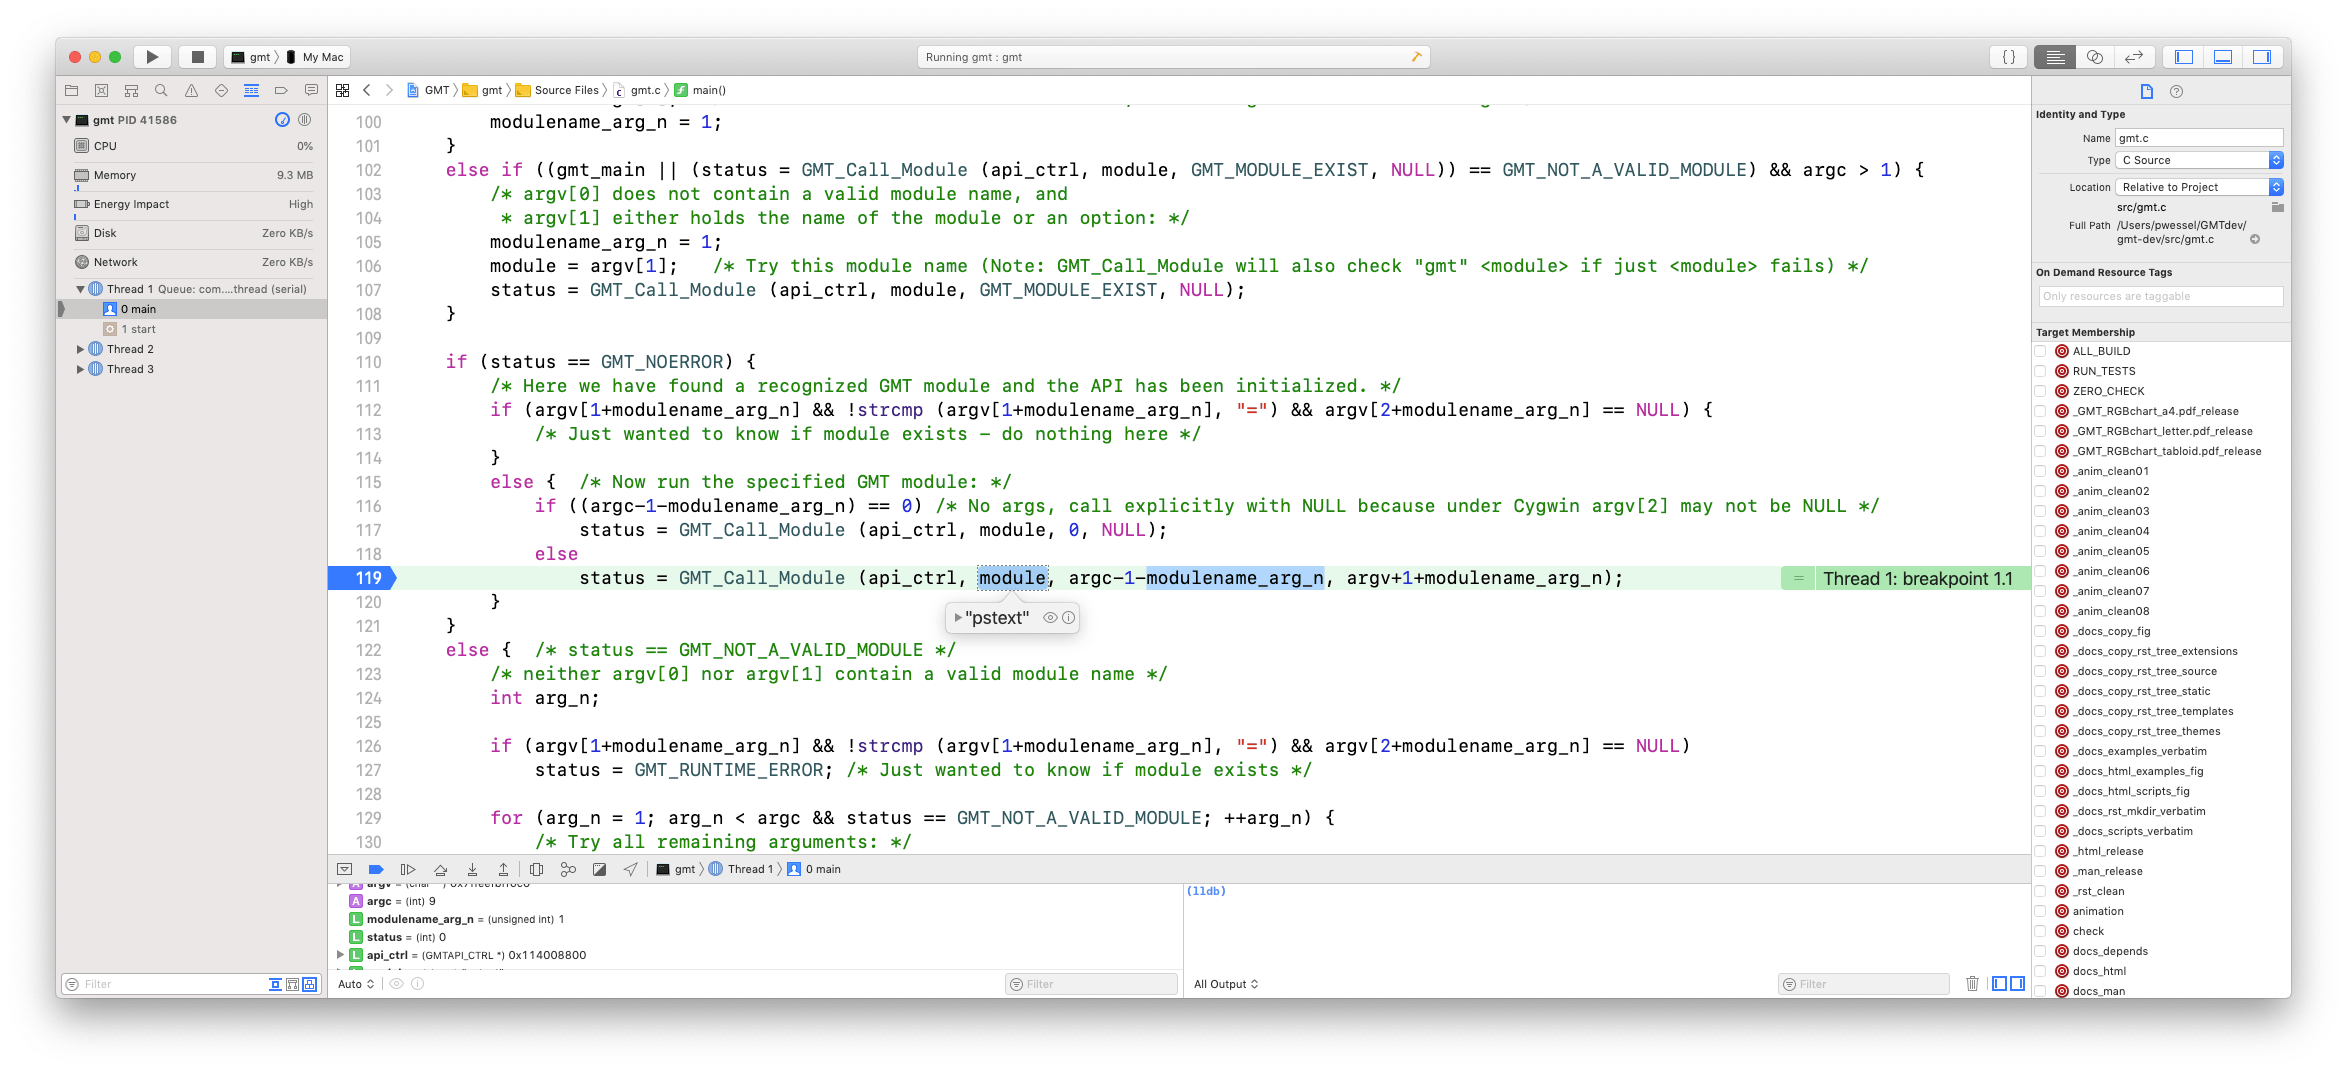
You will see the current line is highlighted light greenish and the execution is stopped. Below the code is a new window that lists some of the variables in the current scope. You can examine that window to see what the variables are set to, you can type “print variable” in the lldb command window on the right (e.g., “print argc”), or you can place the cursor over a variable and a pop-up box will display its value. Below I placed the cursor on the variable “module” on line 119 and this is what it looks like (minus the cursor which is not screen-grabbed!).
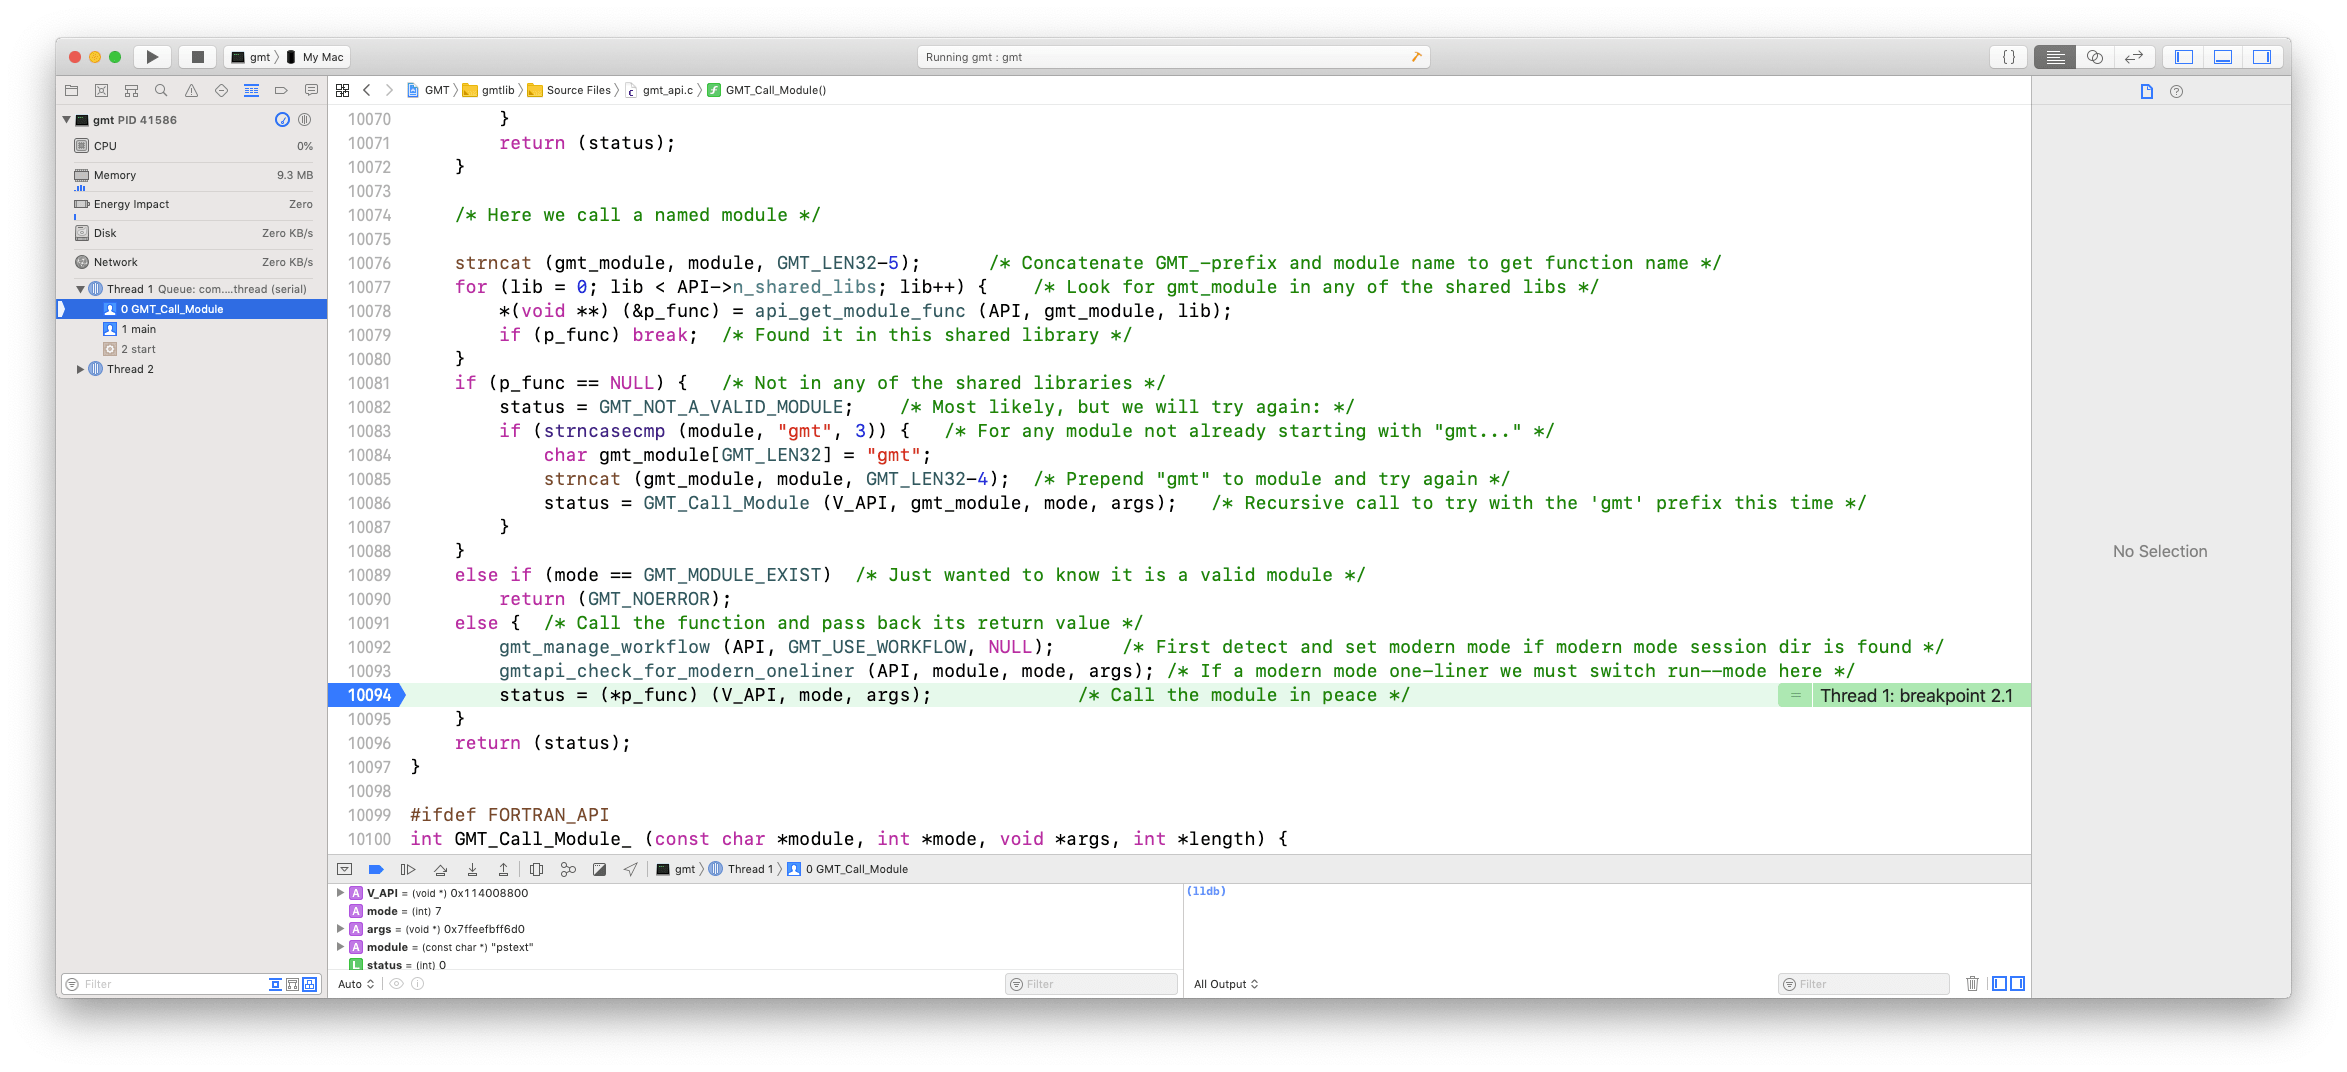
The tool bar below the source code has a pause-play button (continue to next stop point), a step-over button (execute next step but do not go into a function, the step-into button (execute next step which may be going into a function) and the step-out button (finish running current function then step back out). Step into the GMT_Call_Module function using the step-into button, then scroll down to around line 10094 and place another stop point there like I did. Press the pause-play button and you are now about to call your actual C function that correspond to the module (here pstext):
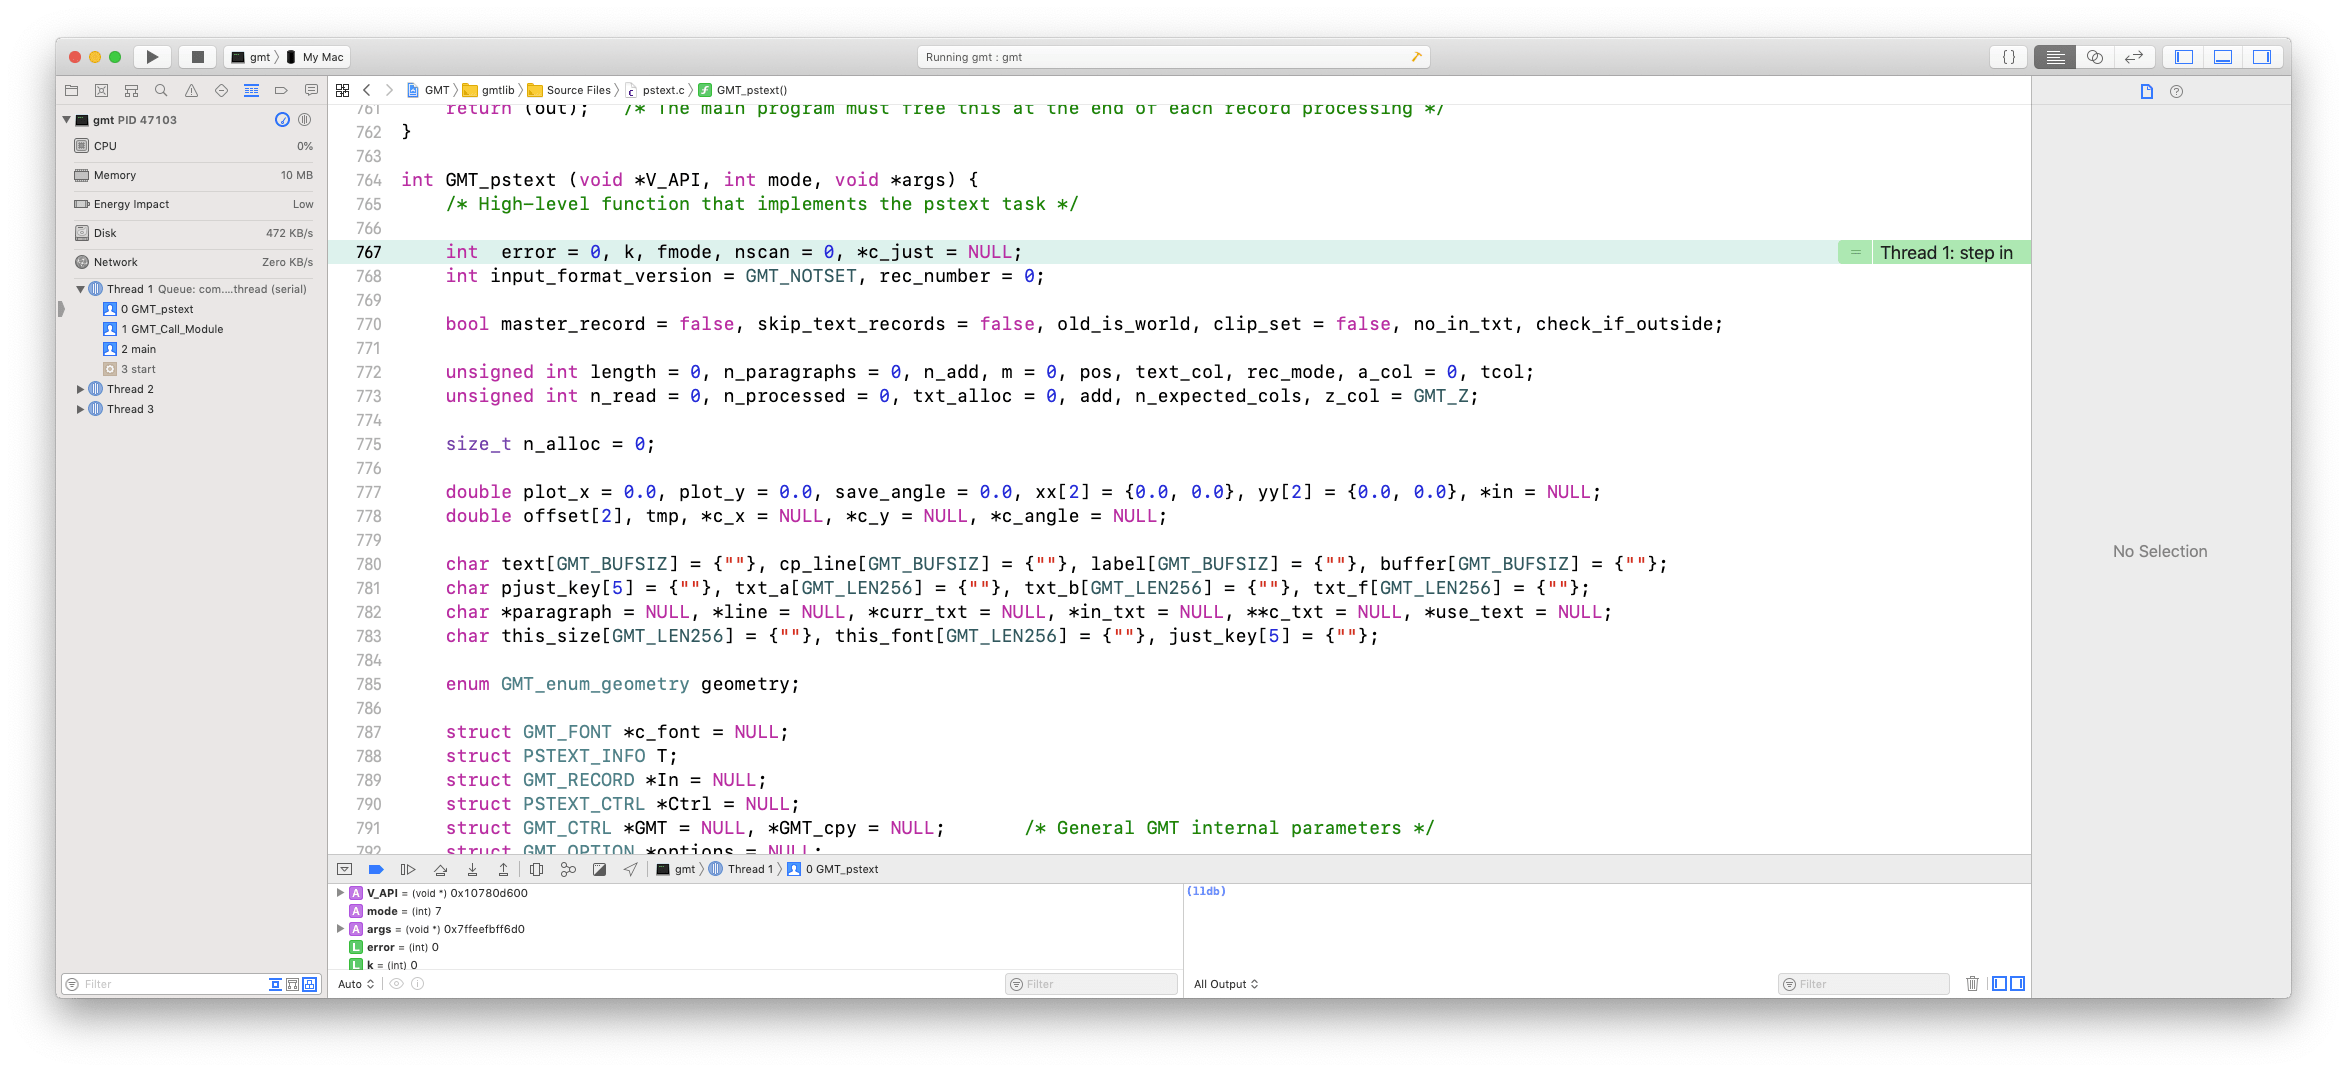
Click the step-into button and find yourself at the first executable line of code in GMT_pstext, the underlying C function at the heart of the pstext module. You can now step your way down the code, using step-over to avoid going into the details of GMT sub-functions (or step-into it if that is the problem), set stop points and push pause-play to advance to the next stop point, examine variables, and so on.
Debug PyGMT in Xcode on macOS
Note: Tested with Xcode 12.0. Install PyGMT following the official instructions at https://www.pygmt.org/dev/install. If you already have the dev version then you may just need to run conda activate pygmt and cd into your pygmt dir and call git pull:
Add conda-forge channel and activate virtual environment (optional):
conda config --prepend channels conda-forge
**Note**: The next step is different from the PyGMT official instructions, because we want to use the GMT dev version
conda create --name pygmt python=3.8 pip numpy pandas xarray netcdf4 packaging

# Activate the PyGMT environment
conda activate pygmt
Install PyGMT in editable/development mode:
cd pygmt
pip install --editable .
Compile GMT using Xcode (see Xcode on macOS), then let $GMT_LIBRARY_PATH point to the full path that contains the src/Debug directory created by xcodebuild so that PyGMT can find the GMT library, and set $GMT_SHAREDIR to point to the full path that contains the share directory.
Open Xcode, select scheme “gmtlib”, navigate to gmt_api.c in the source listing, and set a stop point in the editor, say in GMT_Call_Module or GMT_Create_Session and Xcode will stop at the breakpoint when it is reached.
Type python in the terminal to get a python console, attach the process id or name to Xcode (menu item Debug->Attach to Process by PID or Name), and run PyGMT codes in the Python console. Execution should stop at your stop point after the first GMT library call takes place from your python script. You are now in Xcode and can follow strategies outlined above (Xcode on macOS).
Debug GMT.jl in Xcode on macOS
Note: Tested with Xcode 11.7. First install Julia from your distribution if you have not done so already (e.g., via brew or port). Once that is done you can proceed to installing the master GMT.jl:
Compile GMT using Xcode (see Xcode on macOS), then let $GMT_LIBRARY point to the full path to the libgmt.* file in the src/Debug directory created by xcodebuild so that GMT.jl can find the GMT library.
Type julia in a terminal to get a Julia console, and in that console, update to latest GMT.jl master version by typing:
]
add GMT#master
When done, end package install mode by hitting backspace. Then, load and precompile GMT by typing “using GMT”.
Open Xcode, select scheme “gmtlib”, navigate to gmt_api.c in the source listing, and set a stop point in the editor, say in GMT_Call_Module or GMT_Create_Session and Xcode will stop at the breakpoint when it is reached.
Attach the Julia process id or name in Xcode (menu item Debug->Attach to Process by PID or Name), and run GMT.jl codes in the Julia console. Execution should stop at your stop point after the first GMT library call takes place from your Julia script. You are now in Xcode and can follow strategies outlined above (Xcode on macOS).
Visual Studio Code on macOS
Developers may want to use Visual Studio Code rather than Xcode because it is often faster to configure than Xcode and can be used on multiple platforms. For general information about Visual Studio Code, refer to the VSCode documentation.
Prerequisites
Install the GMT build and runtime dependencies. These instructions assume that you have the Ninja build system installed.
Setup your
ConfigUser.cmakeandConfigUserAdvanced.cmakefollowing the instructions in setting up your environment.Install Visual Studio Code.
Install the
C/C++extension by Microsoft (Click on the extensions tab or View/Extensions). Additional extensions that you may find helpful areCMakeby twxs,CMake Toolsby Microsoft, andBash Debugby rogalmic.Add
.vscode/to your global .gitignore.
Getting started
Navigate to the top of your cloned GMT repository. If you are using the developer aliases, you can enter
gtopin the terminal.Open the workspace in VSCode:
code .You will need to check the repository path in the pop-up window and click ‘Yes, I trust the authors’ in order to debug GMT with VSCode.
Press command+shift+P to open the VSCode command palette. Select ‘C/C++: Edit Configurations (JSON)’. This will create a new
.vscodedirectory that contains all VSCode project settings and a.vscode/c_cpp_properties.jsonfile. This new file should not be listed bygit statusif you properly completed the prerequisite steps. If needed, you can edit the compiler path or add header files to the intellisense includePath. You may need to updatemacFrameworkPathwhen you update your operating system.Create a new file
.vscode/project.envthat will contain environment variables for your project. In VSCode, you can quickly create a new file by right-clicking on the.vscodefolder in the file explorer and typing the file name. Add these contents toproject.envand modify to fit your set-up (i.e., setUSER_NAMEandREPO_DIR):GMT_SESSION_NAME="vscodedebug" USER_NAME="<your user name>" REPO_DIR="<path to the local GMT repository>" GMT_LIBRARY_PATH="${REPO_DIR}/vbuild/gmt6/lib" GMT_SHARE_PATH="${REPO_DIR}/vbuild/gmt6/share" GMT_DATA_SERVER=https://oceania.generic-mapping-tools.org
Building GMT
Create a new
.vscode/tasks.jsonfile. Add these contents to.vscode/tasks.jsonand modify to fit your set-up (e.g., update theCMAKE_OSX_DEPLOYMENT_TARGETflag for your OS):{ "version": "2.0.0", "tasks": [ { "label": "ninja build", "type": "shell", "options": { "cwd": "${workspaceRoot}", "env": { "ADD_FLAGS": "-DCMAKE_OSX_DEPLOYMENT_TARGET=12.1" } }, "command": "rm -rf vbuild; mkdir vbuild; cd vbuild; cmake -DCMAKE_INSTALL_PREFIX=\"${workspaceRoot}/vbuild/gmt6\" -DCMAKE_BUILD_TYPE=Debug ${ADD_FLAGS} -G \"Ninja\" ..; ninja; ninja install; mkdir debug; cp ${workspaceRoot}/.vscode/project.env debug/project.env" }, { "label": "ninja rebuild", "type": "shell", "options": { "cwd": "${workspaceRoot}" }, "command": "cd vbuild; ninja; ninja install; mkdir debug; cp ${workspaceRoot}/.vscode/project.env debug/project.env" } ] }
Press command+shift+p to open the command palette. Select
Tasks: Run Task, then selectninja build, and finally selectRun without scanning the task output.If you make changes to the source code and did not delete the
vbuilddirectory, you can update by pressing command+shift+p, selectingTasks: Run Taskand selectingninja rebuild.
Debugging GMT
Create a new
.vscode/launch.jsonfile. Add these contents and modify to fit your needs:{ "version": "2.0.0", "configurations": [ { "name": "begin", "type": "cppdbg", "request": "launch", "program": "${workspaceFolder}/vbuild/src/gmt", "args": ["begin","test","png"], "stopAtEntry": false, "cwd": "${workspaceFolder}/vbuild/debug/", "environment": [], "envFile": "${workspaceFolder}/vbuild/debug/project.env", "externalConsole": false, "MIMode": "lldb" }, { "name": "basemap", "type": "cppdbg", "request": "launch", "program": "${workspaceFolder}/vbuild/src/gmt", "args": ["basemap","-R0/120/-90/-45","-Bfg","-JS0/-90/10c"], "stopAtEntry": true, "cwd": "${workspaceFolder}/vbuild/debug/", "environment": [], "envFile": "${workspaceFolder}/vbuild/debug/project.env", "externalConsole": false, "MIMode": "lldb" }, { "name": "end", "type": "cppdbg", "request": "launch", "program": "${workspaceFolder}/vbuild/src/gmt", "args": ["end","show"], "stopAtEntry": false, "cwd": "${workspaceFolder}/vbuild/debug/", "environment": [], "envFile": "${workspaceFolder}/vbuild/debug/project.env", "externalConsole": false, "MIMode": "lldb" } ] }
Open
src/gmt.cand add a breakpoint at this line (usually ~L112) by clicking just left of the line number:status = GMT_Call_Module (api_ctrl, module, argc-1-modulename_arg_n, argv+1+modulename_arg_n)
Click on the debug panel and select
gmt beginin the dropdown menu.Click on the green arrow next to
gmt begin.You can then use the debug panel for standard debugging actions including continue, step over, step into, etc.
You can use the variables panel to inspect options or hover the mouse over the variable in the file window for a quick view.
Usually, you would just click continue on the debugger for the
gmt beginstep. Then, you can switch the debugger to the actual command task that you want to debug (in this examplegmt basemap) and once again click the green arrow.To finalize the session and view the output, select the
gmt endstep in the debugger and click the green arrow.
To change the GMT module to debug, either create a new task based on the template provided or modify the name
and args settings for the gmt basemap task in tasks.json. The first argument should be the gmt module and the
remaining arguments to the gmt module are provided as a comma separated list. Any files required by the command should
be placed in vbuild/debug.
You can skip debugging gmt begin, gmt end, or other GMT commands by opening a terminal, adding
vbuild/gmt6/bin to your path, exporting GMT_SESSION_NAME=vscodedebug, and then mixing VSCode
debugging with CLI commands.