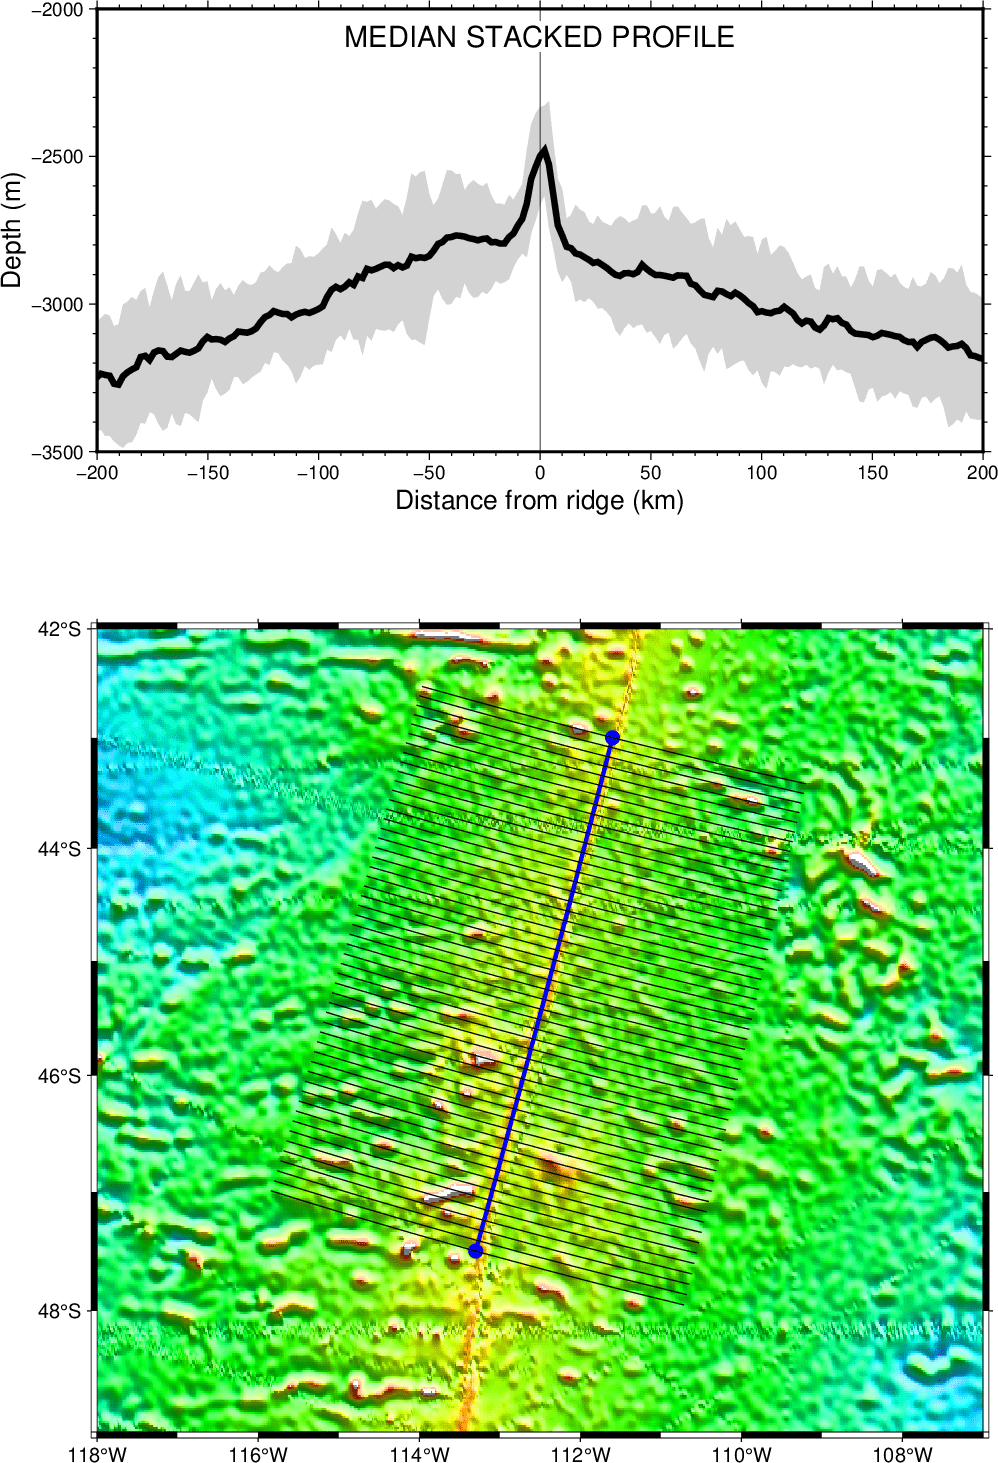
(33) Stacking automatically generated cross-profiles
The script produces the plot in Figure. Here we demonstrate how grdtrack can be used to automatically create a suite of crossing profiles of uniform spacing and length and then sample one or more grids along these profiles; we also use the median stacking option to create a stacked profile, showed above the map, with the gray area representing the \(2\sigma\) confidence bounds on the stacked median profile.
#!/usr/bin/env bash
#               GMT EXAMPLE 33
#
# Purpose:      Illustrate grdtrack's new cross-track and stacking options
# GMT modules:  grdcut, makecpt, convert, grdimage, grdtrack, text, plot
# Unix progs:   cat, rm
#
gmt begin ex33
	# Extract a subset of earth_relief_01m for the East Pacific Rise
	gmt grdcut @earth_relief_01m -R118W/107W/49S/42S -Gspac_33.nc
	gmt makecpt -Crainbow -T-5000/-2000
	gmt grdimage spac_33.nc -I+a15+ne0.75 -JM15c -B --FORMAT_GEO_MAP=dddF
	# Select two points along the ridge
	cat <<- EOF > ridge.txt
	-111.6	-43.0
	-113.3	-47.5
	EOF
	# Plot ridge segment and end points
	gmt plot -Rspac_33.nc -W2p,blue ridge.txt
	gmt plot -Sc0.25c -Gblue ridge.txt
	# Generate cross-profiles 400 km long, spaced 10 km, samped every 2km
	# and stack these using the median, write stacked profile
	gmt grdtrack ridge.txt -Gspac_33.nc -C400k/2k/10k+v -Sm+sstack.txt > table.txt
	gmt plot -W0.5p table.txt
	# Show upper/lower 2-sigma confidence bounds encountered as an envelope
	gmt plot -R-200/200/-3500/-2000 -JX15c/7.5c -W3p stack.txt -i0,1,5,6 -L+b -Glightgray -Yh+3c
	gmt basemap  -Bxafg1000+l"Distance from ridge (km)" -Byaf+l"Depth (m)" -BWSne
	echo "MEDIAN STACKED PROFILE" | gmt text -Gwhite -F+cTC+f14p -Dj8p
	# cleanup
	rm -f ridge.txt table.txt stack.txt spac_33.nc
gmt end show
Stacking automatically generated cross-profiles.