(13) Plotting of vector fields
In many areas, such as fluid dynamics and elasticity, it is desirable to plot vector fields of various kinds. GMT provides a way to illustrate 2-component vector fields using the grdvector utility. The two components of the field (Cartesian or polar components) are stored in separate grid files. In this example we use grdmath to generate a surface \(z(x, y) = x \cdot \exp(-x^2 -y^2)\) and to calculate \(\nabla z\) by returning the x- and y-derivatives separately. We superpose the gradient vector field and the surface z and also plot the components of the gradient in separate windows. A text call to place a header finishes the plot
#!/usr/bin/env bash
#		GMT EXAMPLE 13
#
# Purpose:	Illustrate vectors and contouring
# GMT modules:	set, grdmath, grdcontour, grdvector, subplot
# Unix progs:	rm
#
gmt begin ex13
	gmt set FONT_HEADING 40p,Times-Italic
	gmt grdmath -R-2/2/-2/2 -I0.1 X Y R2 NEG EXP X MUL = z.nc
	gmt grdmath z.nc DDX = dzdx.nc
	gmt grdmath z.nc DDY = dzdy.nc
	gmt subplot begin 2x2 -M0.1c -Ff15c -BWSne -T"z(x,y) = x@~\327@~exp(-x@+2@+-y@+2@+)"
		gmt grdcontour z.nc -C0.05 -A0.1 -Gd5c -S4 -T+d8p/2p -c0,0
		gmt grdcontour z.nc -C0.05 -Gd5c -S4 -c0,1
		gmt grdvector dzdx.nc dzdy.nc -I0.2 -Q0.25c+e+n0.25i/0+h0.5 -Gblack -W1p -S2c
		gmt grdcontour dzdx.nc -C0.10 -A0.5 -Gd5c -S4 -T+d8p/2p -c1,0
		gmt grdcontour dzdy.nc -C0.05 -A0.2 -Gd5c -S4 -T+d8p/2p -c1,1
	gmt subplot end
gmt end show
rm -f z.nc dzdx.nc dzdy.nc
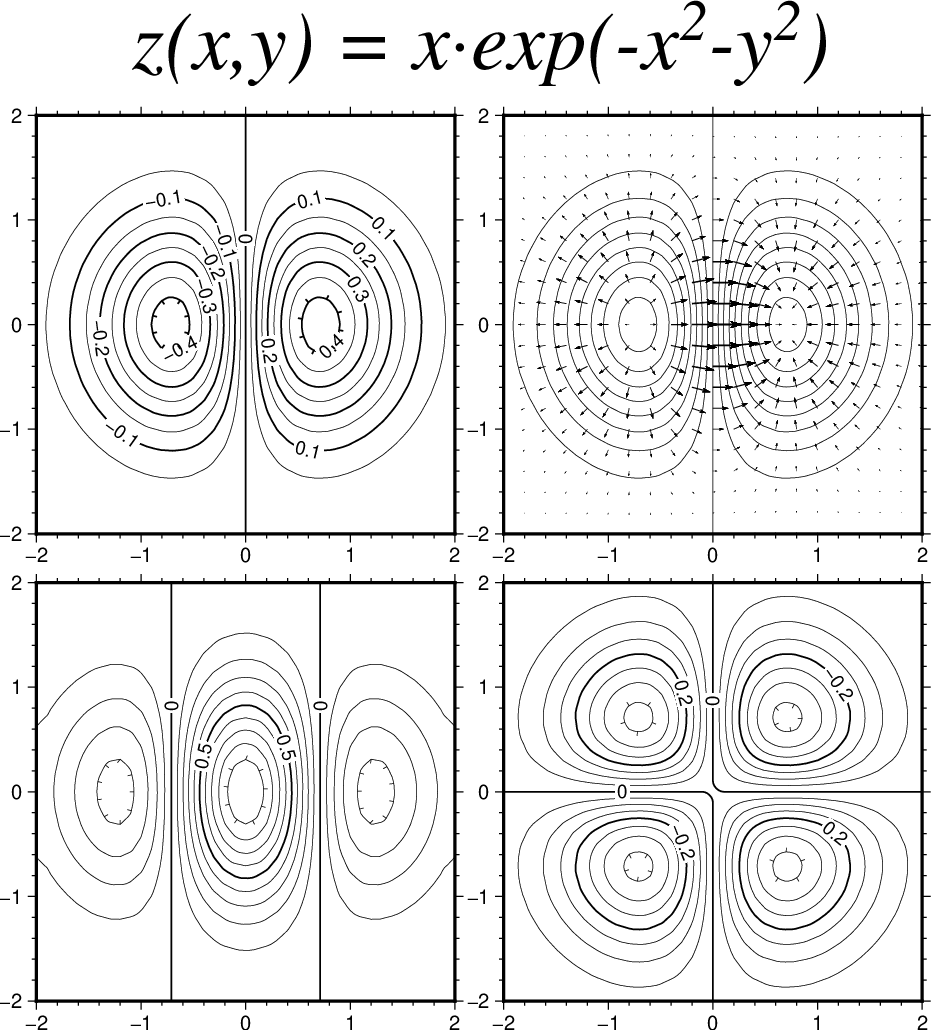
Display of vector fields in GMT.