pslegend
Plot a legend
Synopsis
gmt pslegend [ specfile ] -Drefpoint [ -B[p|s]parameters ] [ -Cdx/dy ] [ -Fbox ] [ -Jparameters ] [ -K ] [ -O ] [ -P ] [ -Rregion ] [ -U[stamp] ] [ -V[level] ] [ -X[a|c|f|r][xshift] ] [ -Y[a|c|f|r][yshift] ] [ -pflags ] [ -qiflags ] [ -ttransp ] [ --PAR=value ]
Description
Makes legends that can be overlaid on maps. It reads specific legend-related information from an input file [or stdin]. Unless otherwise noted, annotations will be made using the primary annotation font and size in effect (i.e., FONT_ANNOT_PRIMARY)
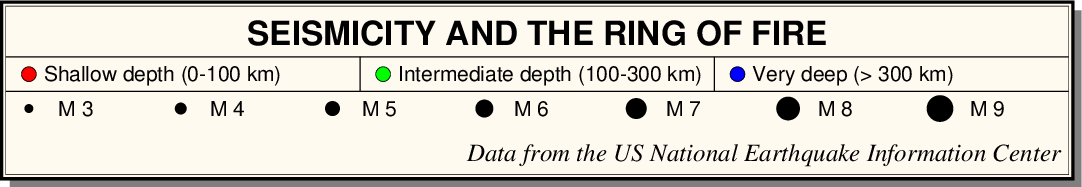
Example of a map legend, here for seismicity in the Pacific region.
Required Arguments
- -D[g|j|J|n|x]refpoint+wwidth[/height][+jjustify][+lspacing][+odx[/dy]]
Defines the reference point on the map for the legend using one of four coordinate systems:
Append glon/lat for map coordinates. Requires both -R and -J to be set.
Append jcode or Jcode for setting the refpoint via a 2-char justification code that refers to the (invisible) projected map bounding box. Requires both -R and -J to be set.
Append nxn/yn for normalized bounding box coordinates (0-1). Requires both -R and -J to be set.
Append xx/y for plot coordinates (append cm, inch, or ppoint).
Append +wwidth[/height] to set the width (and height) of the legend box in plot coordinates (inches, cm, etc.). If height is zero or not given then we estimate height based the expected vertical extent of the items to be placed. By default, the anchor point on the legend is assumed to be the bottom left corner (BL), but this can be changed by appending +j followed by a 2-char justification code justify (see text). Note: If -Dj is used then justify defaults to the same as refpoint, if -DJ is used then justify defaults to the mirror opposite of refpoint. Use +lspacing to change the line-spacing factor in units of the current font size [1.1].
Optional Arguments
- -B[p|s]parameters
Set map boundary frame and axes attributes. (See full description) (See cookbook information).
- -Cdx/dy
Sets the clearance between the legend frame and the internal items [4p/4p].
-F[+cclearances][+gfill][+i[[gap/]pen]][+p[pen]][+r[radius]][+s[[dx/dy/][shade]]]
Without further options, draws a rectangular border around the legend using MAP_FRAME_PEN. The following modifiers can be appended to -F, with additional explanation and examples provided in the The background panel cookbook section:
+cclearance where clearance is either gap, xgap/ygap, or lgap/rgap/bgap/tgap and gap gives a uniform clearance, xgap/ygap gives separate clearances in the x- and y- directions, and lgap/rgap/bgap/tgap gives individual clearances between the map embellishment and the border for each side.
+gfill to fill the box with a color specified by fill [default is no fill].
+i[[gap/]pen] to draw a secondary, inner border as well. Optionally, specify the gap between the inner and outer border and the pen for the inner border [default is a uniform gap between borders of 2p and the MAP_DEFAULT_PEN].
+ppen to specify different pen attributes.
+r[radius] to draw rounded rectangular borders instead with a corner radius set by radius (append units) [defaults is 6p].
+s[[dx/dy/][shade]] to draw an offset background shaded region. Here, dx/dy indicates the shift relative to the foreground frame [default is 4p/-4p] and shade sets the fill style to use for shading [default is gray50].
- -Jparameters
Specify the projection. (See full description) (See cookbook summary) (See projections table).
- -M
Modern mode only: Read both (1) the hidden auto-generated legend information file created by plotting-modules’ -l option and (2) additional information from input file(s) given on the command line (or via stdin) [hidden file only]. For classic mode an input file must be given or else we will read from stdin.
- -Rxmin/xmax/ymin/ymax[+r][+uunit]
Specify the region of interest. (See full description) (See cookbook information).
- -Sscale
Scale all symbol sizes by a common scale [1].
- -Tfile
Modern mode only: Write hidden legend specification file to file.
- -U[label|+c][+jjust][+odx[/dy]]
Draw GMT time stamp logo on plot. (See full description) (See cookbook information).
- -V[level]
Select verbosity level [w]. (See full description) (See cookbook information).
- -X[a|c|f|r][xshift]
Shift plot origin. (See full description) (See cookbook information).
- -Y[a|c|f|r][yshift]
Shift plot origin. (See full description) (See cookbook information).
- -p[x|y|z]azim[/elev[/zlevel]][+wlon0/lat0[/z0]][+vx0/y0] (more …)
Select perspective view.
- -qi[~]rows|limits[+ccol][+a|f|s] (more …)
Select input rows or data limit(s) [default is all rows].
- -ttransp[/transp2] (more …)
Set transparency level(s) in percent.
- -^ or just -
Print a short message about the syntax of the command, then exit (NOTE: on Windows just use -).
- -+ or just +
Print an extensive usage (help) message, including the explanation of any module-specific option (but not the GMT common options), then exit.
- -? or no arguments
Print a complete usage (help) message, including the explanation of all options, then exit.
- --PAR=value
Temporarily override a GMT default setting; repeatable. See gmt.conf for parameters.
Legend Codes
- specfile
This ASCII file contains instructions for the layout of items in the legend. Each legend item is described by a unique record. All records begin with a unique character that is common to all records of the same kind. The order of the legend items is implied by the order of the records. Fourteen different record types are recognized, and the syntax for each of these records are presented below:
- # comment
Records starting with # and blank lines are skipped.
- A cptname
Symbol or cell color fills may be given indirectly via a z-value which can be used for the color look-up via the given CPT cptname. You may switch to other cptname by repeating this command.
- B cptname offset height [ optional arguments ]
The B record will plot a horizontal color bar, colorbar-style in the middle, starting at offset from the left edge, and of the given height. You may add any additional colorbar options as well. Any of the modifiers [+e[b|f][length]][+h][+m[a|c|l|u]][+n[txt]] may be appended to the height argument, while other module options -B -I -L -M -N -S -Z and -p may be appended as optional arguments at the end of the record. See colorbar for details on all modifiers and options.
- C textcolor
The C record specifies the color with which the remaining text is to be printed via z=value (requires a prior A code as well). When C is used in a legend then your font specifications cannot also contain a color specification since we will append ,textcolor to the font. Use - to reset to default color.
- D [offset] pen [-|+|=]
The D record results in a horizontal line with specified pen across the legend with one quarter of the line-spacing left blank above and below the line. Two gaps of offset units are left blank between the horizontal line and the left and right frame sides [0]. If no pen is given we use MAP_GRID_PEN_PRIMARY, and if pen is set to - then no visible line is drawn (we just remember the location as a possible start/stop point for a vertical line; see V). To not add the quarter line-spacing before the line, add -. To not add the spacing after the line, add +. For no spacing at all, add = [Default places a quarter line-spacing both before and after the line].
- F fill1 fill2 … filln
Specify fill (color of pattern) for cells. Alternatively, you can specify an indirect color via z=value (requires a prior A code). If only fill1 is given then it is used to fill the entire row, otherwise give one fill value for each active column (see N). If any fill is - then no fill takes place [Default].
- G gap
The G record specifies a vertical gap of the given length. In addition to the standard units (i, c, p) you may use l for lines. A negative gap will move the current line upwards (thus closing a gap).
- H font|- header
The H record plots a centered text string using the specified font parameters. Use - to default to size and fonttype of FONT_TITLE.
- I imagefile width justification
Place an EPS or raster image in the legend justified relative to the current point. The image width determines the size of the image on the page.
- L font|- justification label
The L record plots a (L)eft, (C)entered, or (R)ight-justified text string within a column using the specified font parameters. Use - to default to the size and font type of FONT_LABEL.
- M slon|- slat length[+aalign][+f][+l[label]][+u] [-Fparam] [ -Rw/e/s/n -Jparam ]
Place a map scale in the legend. Specify slon slat, the point on the map where the scale applies (slon is only meaningful for certain oblique projections. If not needed, you must specify - instead). Give length, the length of the scale in km (for other units append e (meter), f (foot), M (mile), n (nautical mile), or u (survey foot)). Append +f for a fancy map scale [Default is plain]. Append +l to the length to select the default label which equals the distance unit (meter, feet, km, miles, nautical miles, survey feet) and is justified on top of the scale [t]. Change this by giving your own label (append +llabel). Change label alignment with +aalign (choose among l(eft), r(ight), t(op) , and b(ottom)). Apply +u to append the unit to all distance annotations along the scale. If you want to place a map panel behind the scale, add a suitable -F panel option (see basemap for details on panels as well as map scale modifiers). All +modifiers must be appended to length to make a single string argument. If the -R -J supplied to the module is different than the projection needed for the scale (or not given at all, e.g., with -Dx), supply the two optional -R -J settings as well.
- N [ncolumns or relwidth1 relwidth2 … relwidthn]
Change the number of columns in the legend [1]. This only affects the printing of symbols (S) and labels (L). The number of columns stay in effect until N is used again. To get columns of unequal width, instead provide the relative width of each column separated by whitespace. The sum of these widths are equated to the legend width set via -D. If no argument is given the we set n_columns to 1.
- P paragraph-mode-header-for-text
Start a new text paragraph by specifying all the parameters needed (see text -M record description). Note that the module knows what all those values should be, so normally you can leave the entire record (after P) blank or leave it out all together. If you need to set at least one of the parameters directly, you must specify all and set the ones you want to leave at their default value to -.
- S [dx1 symbol size fill pen [ dx2 text ]]
Plots the selected symbol with specified diameter, fill, and outline (see plot). The symbol is centered at dx1 from the left margin of the column, with the optional explanatory text starting dx2 from the margin, printed with FONT_ANNOT_PRIMARY. If dx1 is given as - then it is automatically computed from half the largest symbol size. If dx2 is given as - then it is automatically computed as 1.5 times the largest symbol size. Use - if no fill or outline (pen) is required. Alternatively, the fill may be specified indirectly via z=value and the color is assigned via the CPT look-up (requires a prior A code). When plotting just a symbol, without text, dx2 and text can be omitted. The dx1 value can also be given as a justification code L, C, or R which justifies the symbol with respect to the current column. If no arguments are given to S then we simply skip to the next column. Three plot symbols may take special modifiers: front (f), quoted line (q) and vector (v). You can append modifiers to the symbol and affect how the fronts, quoted lines and vectors are presented (see plot man page for modifiers). The module will determine default settings for all modifiers and secondary arguments if not provided. A few other symbols (the rectangles, ellipse, wedge, mathangle) may take more than a single argument size. Note that for a line segment you should use the horizontal dash symbol (-). If just a single size if given then we will provide reasonable arguments to plot the symbol (See Defaults). Alternatively, combine the required arguments into a single, comma-separated string and use that as the symbol size (again, see plot for details on the arguments needed).
- T paragraph-text
One or more of these T records with paragraph-text printed with FONT_ANNOT_PRIMARY. To specify special positioning and typesetting arrangements, or to enter a paragraph break, use the optional P record.
- V [offset] pen
The V record draws a vertical line between columns (if more than one) using the selected pen. Here, offset is analogous to the offset for the D records but in the vertical direction [0]. The first time V is used we remember the vertical position of the last D line, and the second time V is set we draw from that past location to the most recent location of the D line. Thus, D must be used to mark the start and stop of a vertical line (so V must follow D). If no horizontal line is desired simply give - as pen to D.
Defaults
When attributes are not provided, or extended symbol information (for symbols taking more than just an overall size) are not given as comma-separated quantities, we will provide the following defaults:
Front: The size argument is length[/gap[ticklength]]. Front symbol is left-side (here, that means upper side) box, with ticklength set 30% of the given symbol length (if not specified separately), and *gap defaulting to -1 (one entered front symbol) if not specified. Modifiers to the symbol argument can be provided.
Vector: Head size is 30% of given symbol size.
Ellipse: Minor axis is 65% of major axis (the symbol size), with an azimuth of 0 degrees.
Rectangle: Height is 65% of width (the symbol size).
Rotated rectangle: Same, with a rotation of 30 degrees.
Rounded rectangle: Same as rectangle, but with corner radius of 10% of width.
Mathangle: Angles are -10 and 45 degrees, with arrow head size 30% of symbol size.
Wedge: Angles are -30 and 30 degrees.
Note On Legend Height
As -D suggests, leaving the height off forces a calculation of the expected height. This is an exact calculation except in the case of legends that place paragraph text. Here we simply do a first-order estimate of how many typeset lines might appear. Without access to font metrics this estimate will occasionally be off by 1 line. If so, note the reported height (with -V) and specify a slightly larger or smaller height in -D.
Windows Remarks
Note that under Windows, the percent sign (%) is a variable indicator (like $ under Unix). To indicate a plain percentage sign in a batch script you need to repeat it (%%); hence the font switching mechanism (@%font% and @%%) may require twice the number of percent signs. This only applies to text inside a script or that otherwise is processed by DOS. Data files that are opened and read by the module do not need such duplication.
Classic Mode Arguments
These options are used to manipulate the building of layered GMT PostScript plots in classic mode. They are not available when using GMT modern mode.
- -K (more …)
Do not finalize the PostScript plot.
- -O (more …)
Append to existing PostScript plot.
- -P (more …)
Select “Portrait” plot orientation.
Examples
Note: Below are some examples of valid syntax for this module.
The examples that use remote files (file names starting with @)
can be cut and pasted into your terminal for testing.
Other commands requiring input files are just dummy examples of the types
of uses that are common but cannot be run verbatim as written.
To add an example of a legend to a Mercator plot (map.ps) with the given specifications, use:
gmt makecpt -Cpanoply -T-8/8 > tt.cpt
gmt set FONT_ANNOT_PRIMARY 12p

gmt pslegend -R0/10/0/10 -JM6i -Dx0.5i/0.5i+w5i+jBL+l1.2 -C0.1i/0.1i -F+p+gazure1+r -B5f1 -P > legend.ps <<EOF
# Legend test for gmt pslegend
# G is vertical gap, V is vertical line, N sets # of columns, D draws horizontal line,
# H is ps=legend.ps
#
G -0.1i
H 24p,Times-Roman My Map Legend
D 0.2i 1p
N 2
V 0 1p
S 0.1i c 0.15i p300/12 0.25p 0.3i This circle is hachured
S 0.1i e 0.15i yellow 0.25p 0.3i This ellipse is yellow
S 0.1i w 0.15i green 0.25p 0.3i This wedge is green
S 0.1i f 0.25i blue 0.25p 0.3i This is a fault
S 0.1i - 0.15i - 0.25p,- 0.3i A contour
S 0.1i v 0.25i magenta 0.5p 0.3i This is a vector
S 0.1i i 0.15i cyan 0.25p 0.3i This triangle is boring
D 0.2i 1p
V 0 1p
N 1
M 5 5 600+u+f
G 0.05i
I @SOEST_block4.png 3i CT
G 0.05i
B tt.cpt 0.2i 0.2i -B0
G 0.05i
L 9p,Times-Roman R Smith et al., @%5%J. Geophys. Res., 99@%%, 2000
G 0.1i
T Let us just try some simple text that can go on a few lines.
T There is no easy way to predetermine how many lines may be required
T so we may have to adjust the height to get the right size box.
EOF
rm -f tt.cpt