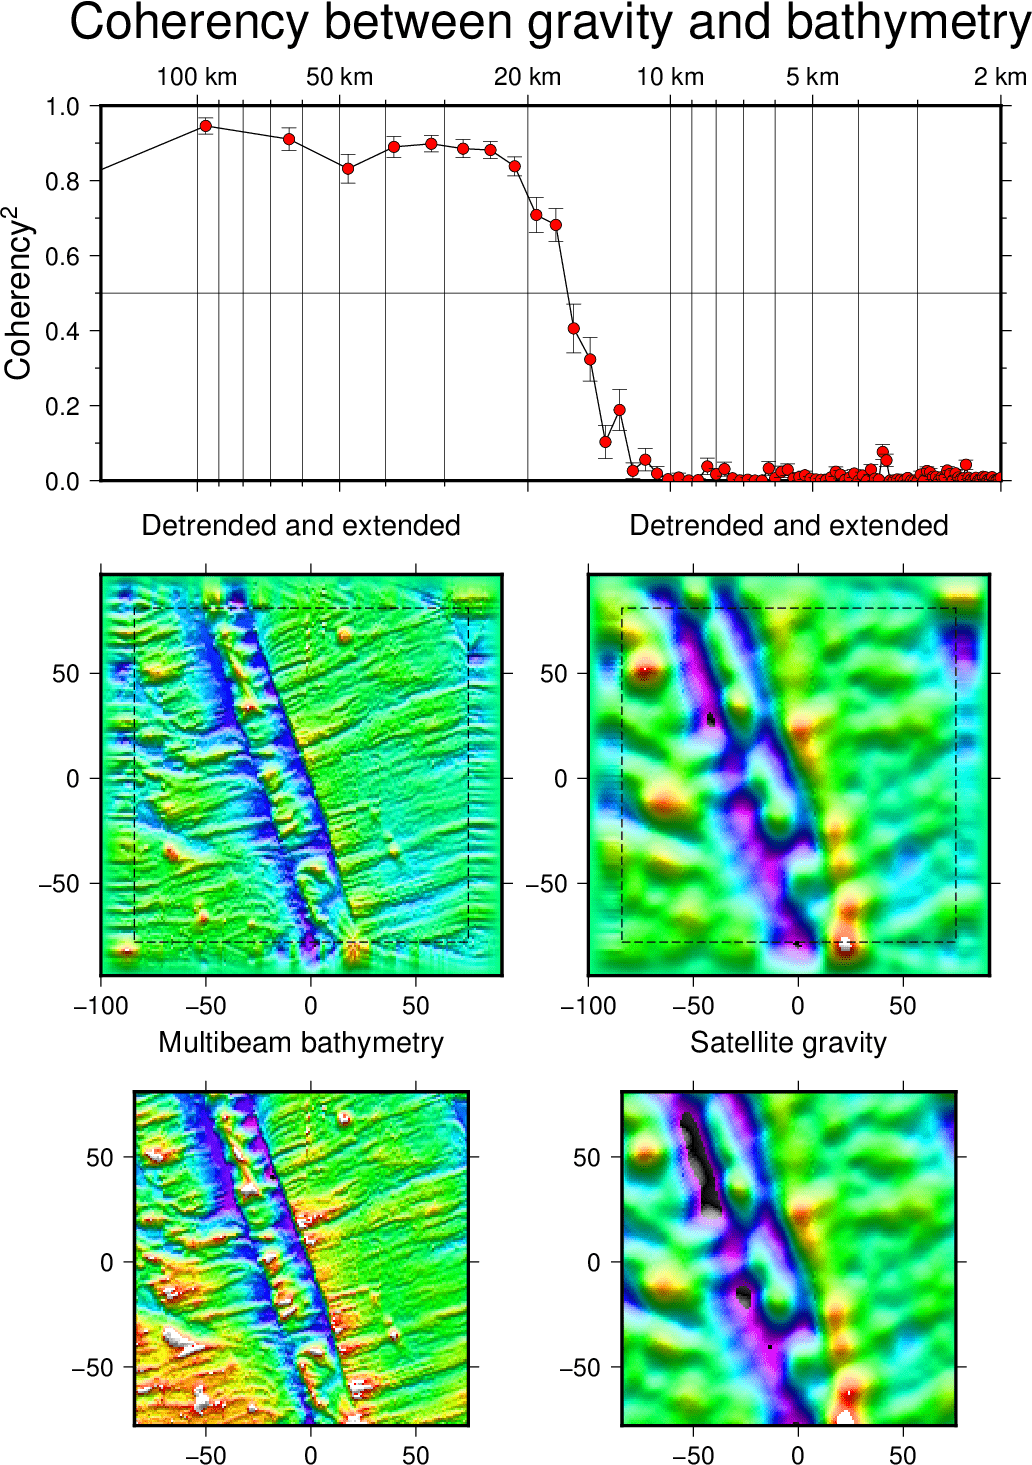
(37) Spectral coherence between gravity and bathymetry grids
The next script produces the plot in Figure. We demonstrate how grdfft is used to compute the spectral coherence between two data sets, here multibeam bathymetry and satellite-derived gravity. The grids are detrended and tapered before the Fourier transform is computed; the intermediate plots show the grids being extended and padded to a suitable dimension.
#!/usr/bin/env bash
#               GMT EXAMPLE 37
#
# Purpose:      Illustrate 2-D FFT and coherence between gravity and bathymetry grids
# GMT modules:  basemap, plot, makecpt, grdfft, grdimage, grdinfo
# Unix progs:   rm
#

gmt begin ex37
	# Testing gmt grdfft coherence calculation with Karen Marks example data
	# Prefix of two .nc files
	G=grav.V18.par.surf.1km.sq
	T=mb.par.surf.1km.sq
	gmt set FONT_TITLE 14p GMT_FFT kiss

	gmt grdinfo @$T.nc -Ib > bbox
	scl=1.4e-5
	sclkm=1.4e-2
	gmt makecpt -Crainbow -T-5000/-3000
	gmt grdimage @${T}.nc -I+a0+nt1 -R@${T}.nc -Jx${scl}i -C -X1.474i -Y1i
	gmt basemap -R-84/75/-78/81 -Jx${sclkm}i -Ba -BWSne+t"Multibeam bathymetry"

	gmt makecpt -Crainbow -T-50/25
	gmt grdimage @${G}.nc -I+a0+nt1 -R@${G}.nc -Jx${scl}i -C -X3.25i
	gmt basemap -R-84/75/-78/81 -Jx${sclkm}i -Ba -BWSne+t"Satellite gravity"

	gmt grdfft @${T}.nc @${G}.nc -E+wk -N192/192+d+wtmp > cross.txt

	gmt makecpt -Crainbow -T-1500/1500
	gmt grdimage ${T}_tmp.nc -I+a0+nt1 -R${T}_tmp.nc -Jx${scl}i -X-3.474i -Y3i
	gmt plot bbox -L -W0.5p,-
	gmt basemap -R-100/91/-94/97 -Jx${sclkm}i -Ba -BWSne+t"Detrended and extended"

	gmt makecpt -Crainbow -T-40/40
	gmt grdimage ${G}_tmp.nc -I+a0+nt1 -R${G}_tmp.nc -Jx${scl}i -C -X3.25i
	gmt plot bbox -L -W0.5p,-
	gmt basemap -R-100/91/-94/97 -Jx${sclkm}i -Ba -BWSne+t"Detrended and extended"

	gmt set FONT_TITLE 24p
	gmt plot -R2/160/0/1 -JX-6il/2.5i -Bxa2f3g3+u" km" -Byafg0.5+l"Coherency@+2@+" \
		-BWsNe+t"Coherency between gravity and bathymetry" -X-3.25i -Y3.3i cross.txt -i0,15 -W0.5p
	gmt plot cross.txt -i0,15,16 -Sc0.075i -Gred -W0.25p -Ey
	rm -f cross.txt *_tmp.nc ?.cpt bbox
gmt end show

Spectral coherence between gravity and bathymetry grids.