(40) Line simplification
This example demonstrate the Douglas-Peucker line simplification algorithm as implemented in the tool gmtsimplify. We show the full resolution coastline of Australia and two much simplified versions using two different thresholds.
#!/usr/bin/env bash
#               GMT EXAMPLE 40
#
# Purpose:      Illustrate line simplification and area calculations
# GMT modules:  basemap, text, plot, gmtsimplify, gmtspatial, subplot
# Unix progs:   awk, rm
#

# set AWK to awk if undefined
AWK=${AWK:-awk}

gmt begin ex40
	gmt spatial @GSHHS_h_Australia.txt -fg -Qk > centroid.txt
	gmt spatial @GSHHS_h_Australia.txt -fg -Qk | $AWK '{printf "Full area = %.0f km@+2@+\n", $3}' > area.txt

	gmt subplot begin 2x1 -Fs5.5i/5i -R112/154/-40/-10 -JM5.5i
		gmt subplot set 0
		gmt basemap -B20+lightgray -BWsne+g240/255/240
		gmt plot @GSHHS_h_Australia.txt -Wfaint -G240/240/255
		gmt plot @GSHHS_h_Australia.txt -Sc0.01c -Gred
		gmt simplify @GSHHS_h_Australia.txt -T100k > T100k.txt
		gmt spatial T100k.txt -fg -Qk | $AWK '{printf "Reduced area = %.0f km@+2@+\n", $3}' > area_T100k.txt
		gmt plot -W1p,blue T100k.txt
		gmt plot -Sx0.3i -W3p centroid.txt
		gmt text -Dj0.1i/0.1i -F+cLT+jTL+f18p+t"T = 100 km"
		gmt text area.txt -F+f14p+cCM
		gmt text area_T100k.txt -F+f14p+cLB -Dj0.2i

		gmt subplot set 1
		gmt basemap -B20+lightgray -BWSne+g240/255/240
		gmt plot @GSHHS_h_Australia.txt -Wfaint -G240/240/255
		gmt plot @GSHHS_h_Australia.txt -Sc0.01c -Gred
		gmt simplify @GSHHS_h_Australia.txt -T500k > T500k.txt
		gmt spatial T500k.txt -fg -Qk | $AWK '{printf "Reduced area = %.0f km@+2@+\n", $3}' > area_T500k.txt
		gmt plot -W1p,blue T500k.txt
		gmt plot -Sx0.3i -W3p centroid.txt
		gmt text -Dj0.1i/0.1i -F+cLT+jTL+f18p+t"T = 500 km"
		gmt text area.txt -F+f14p+cCM
		gmt text area_T500k.txt -F+f14p+cLB -Dj0.2i
	gmt subplot end
	rm -f centroid.txt area*.txt T*.txt
gmt end show
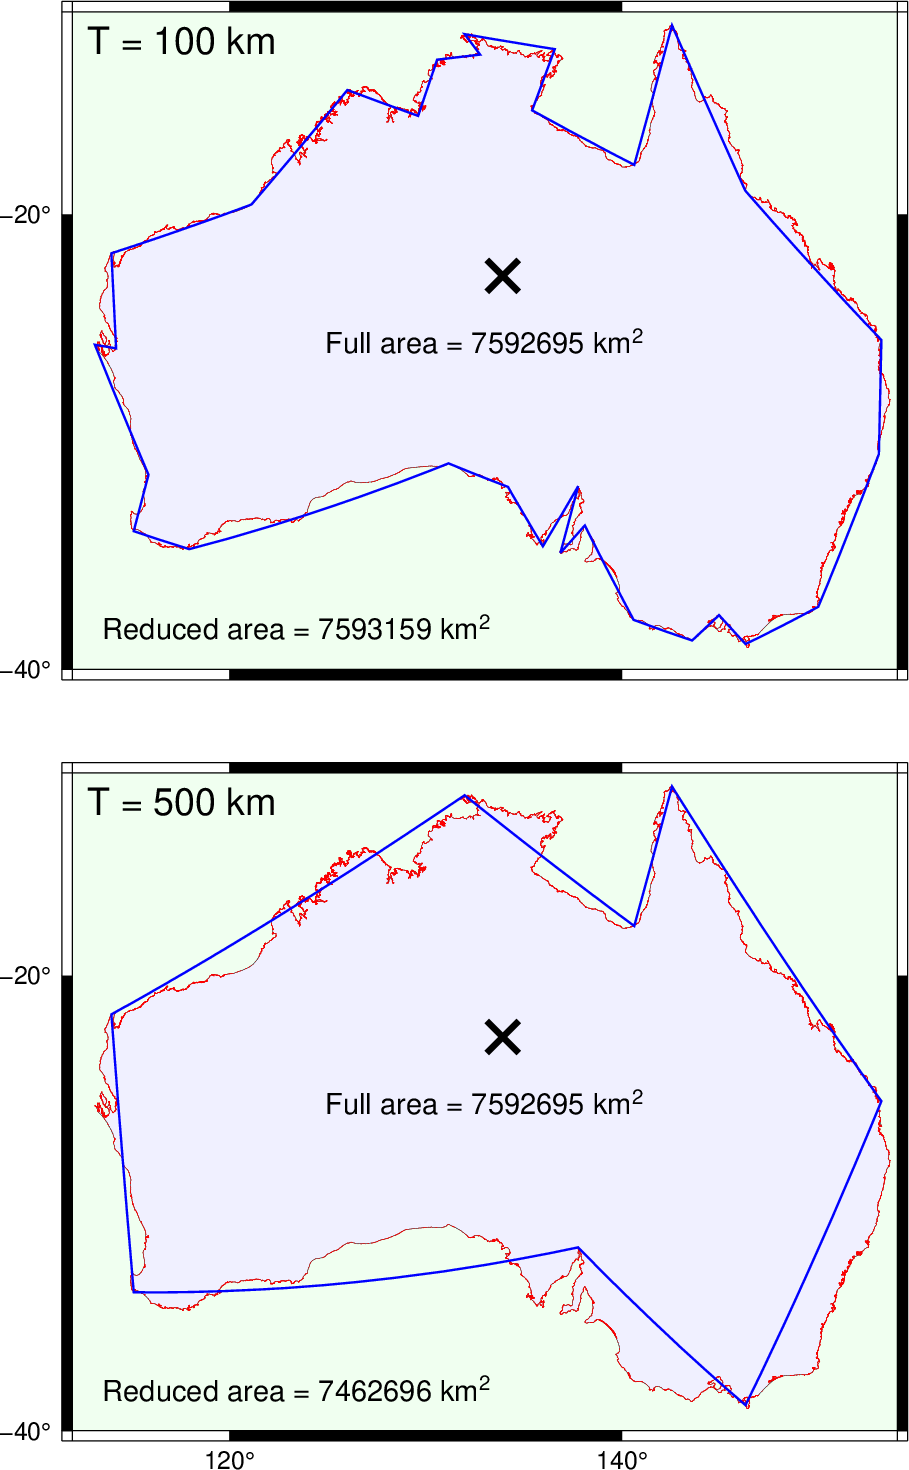
Illustrate line simplification and area calculations.