(8) A 3-D histogram
The program plot3d allows us to plot
three-dimensional symbols, including columnar plots. As a simple
demonstration, we will convert a gridded netCDF of bathymetry into an
ASCII xyz table and use the height information to draw a 2-D
histogram in a 3-D perspective view. We also use the height information
to set to color of each column via a CPT file. Our gridded bathymetry file is a remote file
called guinea_bay.nc and covers the region from 0 to 5 E and 0 to 5 N. Depth ranges
from -5000 meter to sea-level. We produce the Figure by running this script:
#!/usr/bin/env bash
#		GMT EXAMPLE 08
#
# Purpose:	Make a 3-D bar plot
# GMT modules:	grd2xyz, makecpt, text, plot3d
# Unix progs:	echo
#
gmt begin ex08
	gmt makecpt -Ccubhelix -T-5000/0
	gmt grd2xyz @guinea_bay.nc | gmt plot3d -B -Bz1000+l"Topography (m)" -BWSneZ+b+tETOPO5 \
		-R-0.1/5.1/-0.1/5.1/-5000/0 -JM5i -JZ6i -p200/30 -So0.0833333ub-5000 -Wthinnest -C -i0-2,2
	echo '0.1 4.9 This is the surface of cube' | gmt text -JZ -Z0 -F+f24p,Helvetica-Bold+jTL -p
gmt end show
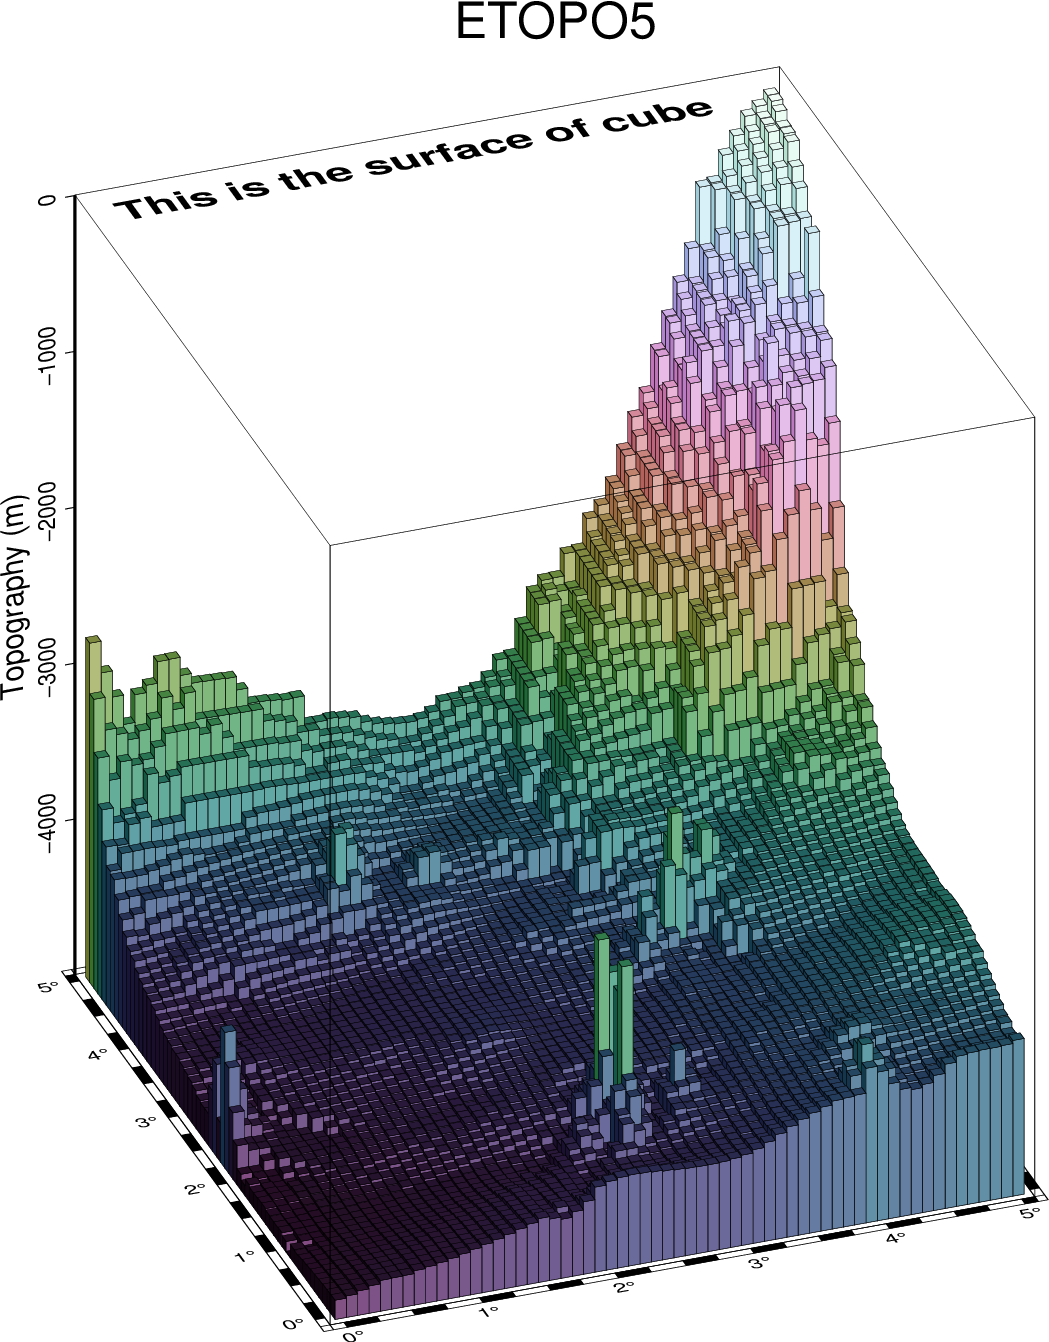
A 3-D histogram.