The Generic Mapping Tools
A Map-Making Tutorial
Pål (Paul) Wessel
SOEST, University of Hawai’i at Manoa
Walter H. F. Smith
Laboratory for Satellite Altimetry, NOAA/NESDIS/STAR
Remko Scharroo
EUMETSAT, Darmstadt, Germany
Joaquim F. Luis
Universidade do Algarve, Faro, Portugal
Florian Wobbe
Alfred Wegener Institute, Germany
1. Introduction
The purpose of this tutorial is to introduce new users to GMT, outline the GMT environment, and enable you to make several forms of graphics without having to know too much about UNIX and UNIX tools. We will not be able to cover all aspects of GMT nor will we necessarily cover the selected topics in sufficient detail. Nevertheless, it is hoped that the exposure will prompt the users to improve their GMT and UNIX skills after completion of this short tutorial.
1.1. GMT overview: History, philosophy, and usage
1.1.1. Historical highlights
The GMT system was initiated in late 1987 at Lamont-Doherty Earth Observatory, Columbia University by graduate students Paul Wessel and Walter H. F. Smith. Version 1 was officially introduced to Lamont scientists in July 1988. GMT 1 migrated by word of mouth (and tape) to other institutions in the United States, UK, Japan, and France and attracted a small following. Paul took a Post-doctoral position at SOEST in December 1989 and continued the GMT development. Version 2.0 was released with an article in EOS, October 1991, and quickly spread worldwide. Version 3.0 in 1993 which was released with another article in EOS on August 15, 1995. A major upgrade to GMT 4.0 took place in Oct 2004. Finally, in 2013 we released the new GMT 5 series and we have updated this tutorial to reflect the changes in style and syntax. However, GMT 5 is generally backwards compatible with GMT 4 syntax. GMT is used by tens of thousands of users worldwide in a broad range of disciplines.
1.1.2. Philosophy
GMT follows the UNIX philosophy in which complex tasks are broken down into smaller and more manageable components. Individual GMT modules are small, easy to maintain, and can be used as any other UNIX tool. GMT is written in the ANSI C programming language (very portable), is POSIX compliant, and is independent of hardware constraints (e.g., memory). GMT was deliberately written for command-line usage, not a windows environment, in order to maximize flexibility. We standardized early on to use PostScript output instead of other graphics formats. Apart from the built-in support for coastlines, GMT completely decouples data retrieval from the main GMT modules. GMT uses architecture-independent file formats.
1.1.3. GMT installation considerations
See the GMT wiki for how to install GMT. In addition, we recommend access to a PostScript previewer (e.g., gv (or ghostview or plain ghostscript)), and any flavor of the UNIX operating system (UNIX, Linux, OS X, Cygwin, MinGW, etc.). We do not recommend using the DOS command window under Windows.
2. Session One
2.1. Tutorial setup
We assume that GMT has been properly and fully installed and that the GMT executables are in your executable path described on the GMT wiki. You should be able to type gmt in your terminal and it will display the GMT splash screen with version number and the top-level options. If not then you need to work on your user environment, adding the path to the gmt executable to your search path.
All GMT man pages, documentation, and gallery example scripts are available from the GMT documentation web page. It is assumed these pages have been installed locally at your site; if not they are always available from the main GMT site.
We recommend you create a sub-directory called tutorial, cd into that directory, and copy all the tutorial files directly there. Depending on your installation the tutorial files are likely in a directory like /usr/share/doc/gmt/tutorial.
As we discuss GMT principles it may be a good idea to consult the GMT Technical Reference and Cookbook for more detailed explanations.
The tutorial data sets are distributed via the GMT cache server. You will therefore find that all those files have @ prepended to their names. This will ensure the file is copied from the server before being used, hence you do not need to download any of the data manually. The downside is that you need an Internet connection to run the examples by cut and paste.
For all but the simplest GMT jobs it is recommended that you place all the GMT (and UNIX) commands in a shell script file and make it executable. To ensure that UNIX recognizes your script as a shell script it is a good habit always to start the script with the line #!/bin/bash or #!/bin/csh, depending on the shell you prefer to use. All the examples in this tutorial assumes you are running the Bourne Again shell, bash, and you will need to modify some of the constructs, such as i/o redirection, to run these examples under csh. We strongly recommend bash over csh due the ability to define functions.
Making a script executable is accomplished using the chmod command, e.g., the script figure_1.sh is made executable with “chmod +x figure_1.sh”.
To view a PostScript file (e.g., map.ps) on a UNIX workstation we use gv map.ps. On some systems there will be similar commands, like ghostview or gs and even open under OS X (which first converts your PostScript to PDF). In this text we will use gv; please substitute the relevant PostScript previewer on your system. Very often it is more productive to convert these PS files to PDF using the psconvert module. Turning the file map.ps to map.pdf is done with
gmt psconvert -Tf map.ps
Please cd into the directory tutorial. We are now ready to start.
2.2. The GMT environment: What happens when you run GMT ?
To get a good grasp on GMT one must understand what is going on “under the hood”. The GMT Run-Time Environment illustrates the relationships you need to be aware of at run-time.
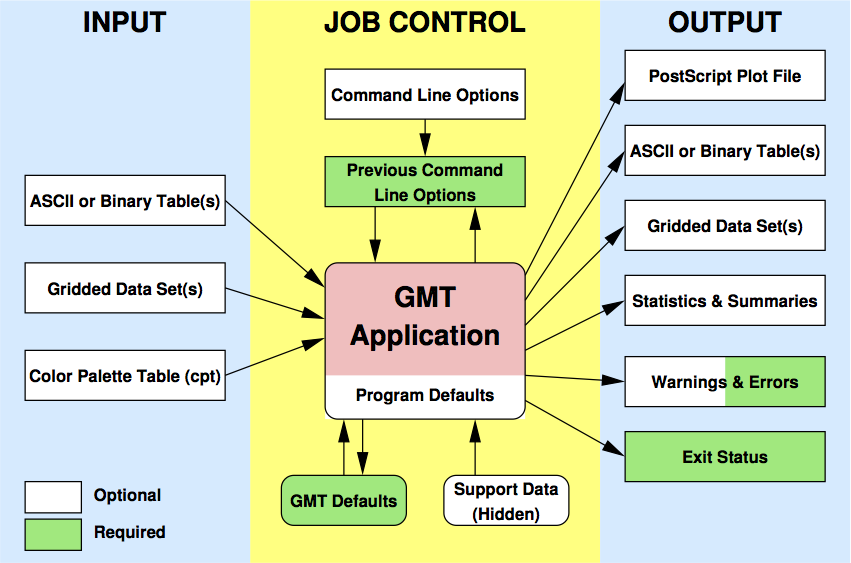
The GMT run-time environment. The will initiate with a set of system defaults that you can override with having your own gmt.conf file in the current directory, specifying GMT parameters via the --PAR=value technique, and supply module options. Some GMT modules will read hidden data (like coastlines) but most will explicitly need to be given user data.
2.2.1. Input data
A GMT module may or may not take input files. Three different types of input are recognized (more details can be found in Appendix B in the Technical Reference):
Data tables. These are rectangular tables with a fixed number of columns and unlimited number of rows. We distinguish between two groups:
- ASCII (Preferred unless files are huge)
- Binary (to speed up input/output)
Such tables may have segment headers and can therefore hold any number of subsets such as individual line segments or polygons.
Gridded dated sets. These are data matrices (evenly spaced in two coordinates) that come in two flavors:
- Grid-line registration
- Pixel registration
You may choose among several file formats (even define your own format), but the GMT default is the architecture-independent netCDF format.
Color palette table (For imaging, color plots, and contour maps). We will discuss these later.
2.2.2. Job Control
GMT modules may get operational parameters from several places:
- Supplied command line options/switches or module defaults.
- Short-hand notation to select previously used option arguments (stored in gmt.history).
- Implicitly using GMT defaults for a variety of parameters (stored in gmt.conf).
- May use hidden support data like coastlines or PostScript patterns.
2.2.3. Output data
There are 6 general categories of output produced by GMT:
- PostScript plot commands.
- Data Table(s).
- Gridded data set(s).
- Statistics & Summaries.
- Warnings and Errors, written to stderr.
- Exit status (0 means success, otherwise failure).
Note: GMT automatically creates and updates a history of past GMT command options for the common switches. This history file is called gmt.history and one will be created in every directory from which GMT modules are executed. Many initial problems with GMT usage result from not fully appreciating the relationships shown in Figure GMT Environment .
2.3. The UNIX Environment: Entry Level Knowledge
2.3.1. Redirection
Most GMT modules read their input from the terminal (called stdin) or from files, and write their output to the terminal (called stdout). To use files instead one can use redirection:
gmt module input-file > output-file         # Read a file and redirect output
gmt module < input-file > output-file       # Redirect input and output
gmt module input-file >> output-file        # Append output to existing file
In this example, and in all those to follow, it is assumed that you do not have the shell variable noclobber set. If you do, it prevents accidental overwriting of existing files. That may be a noble cause, but it is extremely annoying. So please, unset noclobber.
2.3.2. Piping (|)
Sometimes we want to use the output from one module as input to another module. This is achieved with pipes:
Someprogram | gmt module1 | gmt module1 > OutputFile (or | lp)
2.3.3. Standard error (stderr)
Most programs and GMT modules will on occasion write error messages. These are typically written to a separate data stream called stderr and can be redirected separately from the standard output (which goes to stdout). To send the error messages to the same location as standard output we use
program > errors.log 2>&1
When we want to save both program output and error messages to separate files we use the following syntax:
gmt module > output.txt 2> errors.log
2.3.4. File name expansion or “wild cards”
UNIX provides several ways to select groups of files based on name patterns:
Code Meaning * Matches anything ? Matches any single character list Matches characters in the list range Matches characters in the given range
You can save much time by getting into the habit of selecting “good” filenames that make it easy to select subsets of all files using the UNIX wild card notation.
Examples:
- gmt module data_*.txt operates on all files starting with “data_” and ending in “.txt”.
- gmt module line_?.txt works on all files starting with “line_” followed by any single character and ending in “.txt”.
- gmt module section_1[0-9]0.part_[12] only processes data from sections 100 through 190, only using every 10th profile, and gets both part 1 and 2.
2.4. Laboratory Exercises
We will begin our adventure by making some simple plot axes and coastline basemaps. We will do this in order to introduce the all-important common options -B, -J, and -R and to familiarize ourselves with a few selected GMT projections. The GMT modules we will utilize are psbasemap and pscoast. Please consult their manual pages for reference.
2.4.1. Linear projection
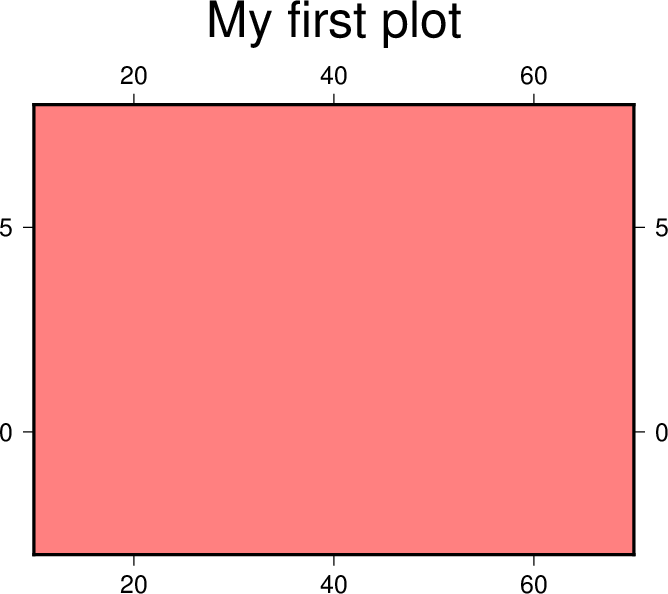
We start by making the basemap frame for a linear x-y plot. We want it to go from 10 to 70 in x and from -3 to 8 in y, with automatic annotation intervals. Finally, we let the canvas be painted light red and have dimensions of 4 by 3 inches. Here’s how we do it:
gmt psbasemap -R10/70/-3/8 -JX4i/3i -Ba -B+glightred+t"My first plot" -P > GMT_tut_1.ps
You can view the result with gv GMT_tut_1.ps and it should look like our example 1 below. Examine the psbasemap documentation so you understand what each option means.
Exercises:
- Try change the -JX values.
- Try change the -B values.
- Omit the -P.
- Change title and canvas color.
2.4.2. Logarithmic projection
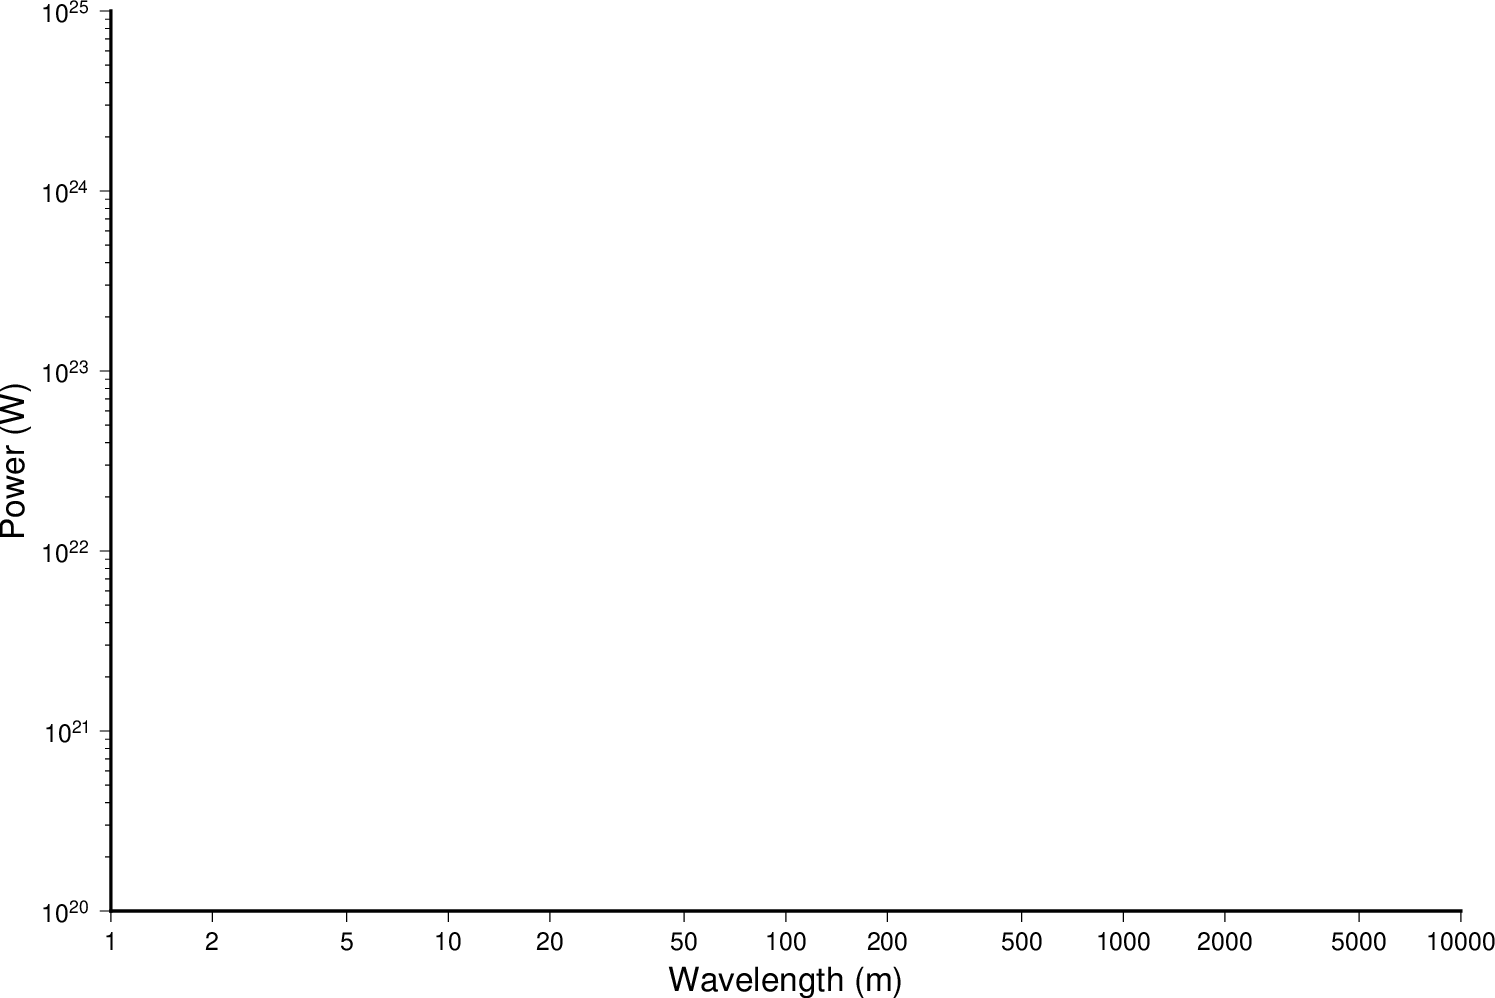
We next will show how to do a basemap for a log--log plot. We have no data set yet but we will imagine that the raw x data range from 3 to 9613 and that y ranges from 3.2 10^20 to 6.8 10^24. One possibility is
gmt psbasemap -R1/10000/1e20/1e25 -JX9il/6il -Bxa2+l"Wavelength (m)" -Bya1pf3+l"Power (W)" -BWS > GMT_tut_2.ps
Make sure your plot looks like our example 2 below
Exercises:
- Do not append l to the axes lengths.
- Leave the p modifier out of the -B string.
- Add g3 to each side of the slash in -B.
2.4.3. Mercator projection
Despite the problems of extreme horizontal exaggeration at high latitudes, the conformal Mercator projection (-JM) remains the stalwart of location maps used by scientists. It is one of several cylindrical projections offered by GMT; here we will only have time to focus on one such projection. The complete syntax is simply
-JMwidth
To make coastline maps we use pscoast which automatically will access the GMT coastline, river and border data base derived from the GSHHG database [See Wessel and Smith, 1996]. In addition to the common switches we may need to use some of several pscoast-specific options:
Option Purpose -A Exclude small features or those of high hierarchical levels (see Appendix K) -D Select data resolution (bull, high, intermediate, low, or crude) -G Set color of dry areas (default does not paint) -I Draw rivers (chose features from one or more hierarchical categories) -L Plot map scale (length scale can be km, miles, or nautical miles) -N Draw political borders (including US state borders) -S Set color for wet areas (default does not paint) -W Draw coastlines and set pen thickness
Main options when making coastline plots or overlays.
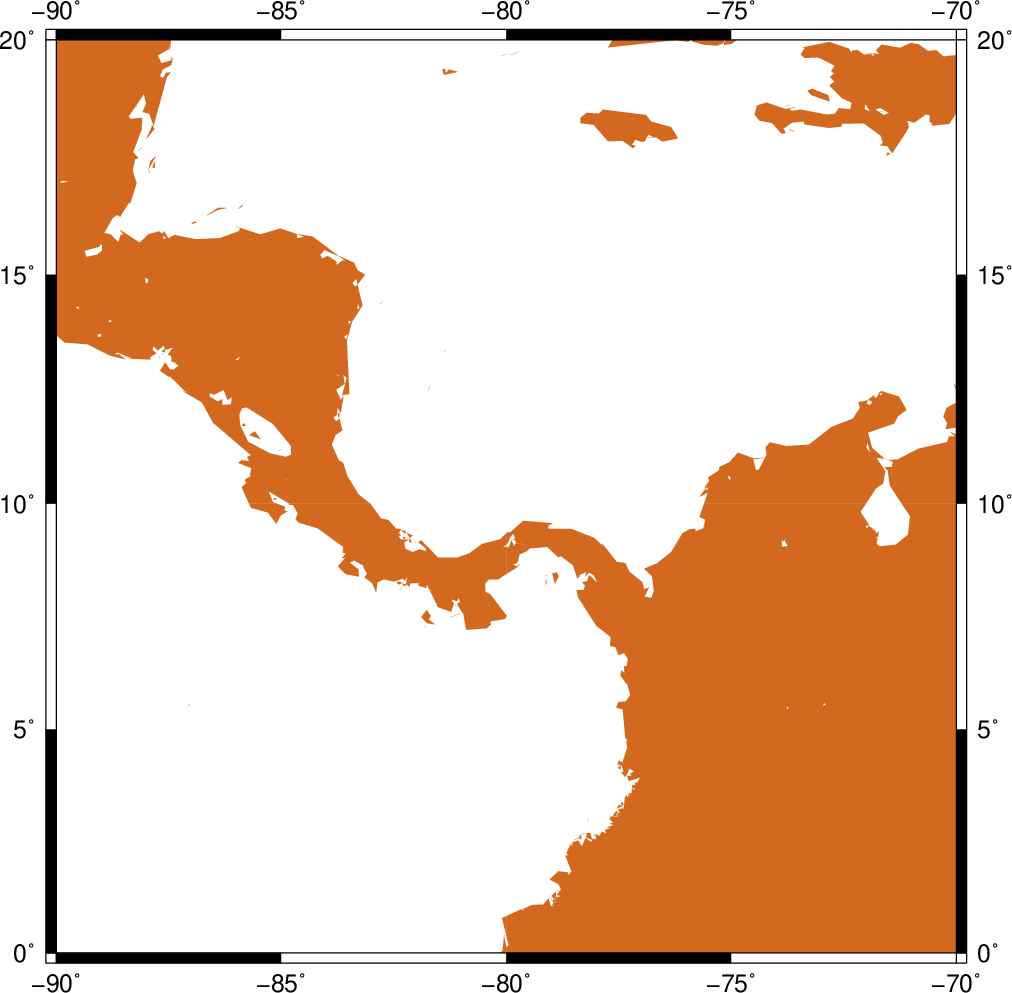
One of -W, -G, -S must be selected. Our first coastline example is from Latin America:
gmt pscoast -R-90/-70/0/20 -JM6i -P -Ba -Gchocolate > GMT_tut_3.ps
Your plot should look like our example 3 below
Exercises:
- Add the -V option.
- Try -R270/290/0/20 instead. What happens to the annotations?
- Edit your gmt.conf file, change FORMAT_GEO_MAP to another setting (see the gmt.conf documentation), and plot again.
- Pick another region and change land color.
- Pick a region that includes the north or south poles.
- Try -W0.25p instead of (or in addition to) -G.
2.4.4. Albers projection
The Albers projection (-JB) is an equal-area conical projection; its conformal cousin is the Lambert conic projection (-JL). Their usages are almost identical so we will only use the Albers here. The general syntax is
-JBlon_0/lat_0/lat_1/lat_2/width
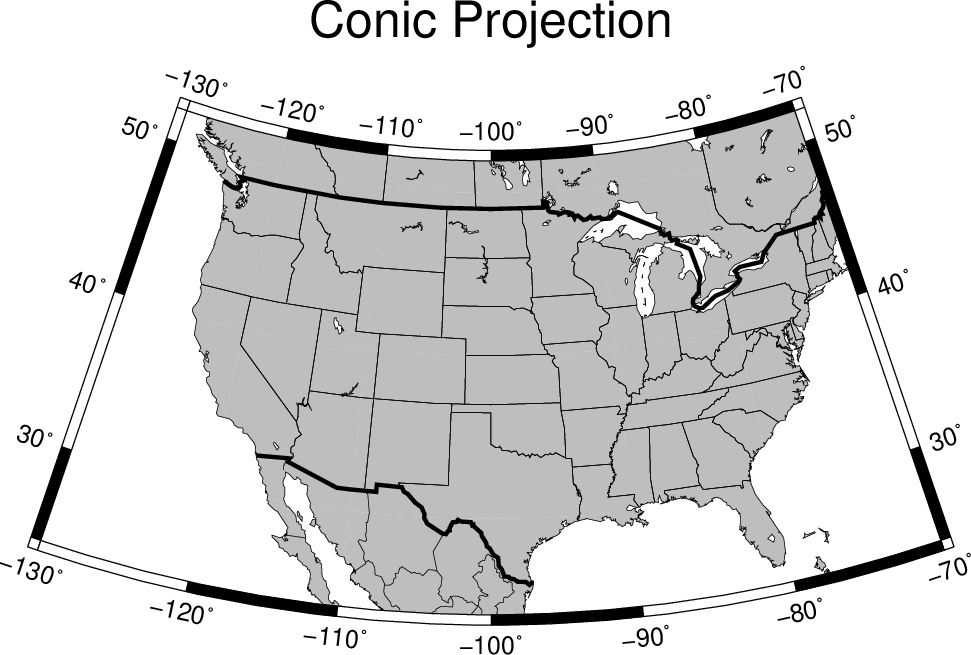
where (lon_0, lat_0) is the map (projection) center and lat_1, lat_2 are the two standard parallels where the cone intersects the Earth’s surface. We try the following command:
gmt pscoast -R-130/-70/24/52 -JB-100/35/33/45/6i -Ba -B+t"Conic Projection" -N1/thickest -N2/thinnest -A500 -Ggray -Wthinnest -P > GMT_tut_4.ps
Your plot should look like our example 4 below
Exercises:
- Change the parameter MAP_GRID_CROSS_SIZE_PRIMARY to make grid crosses instead of gridlines.
- Change -R to a rectangular box specification instead of minimum and maximum values.
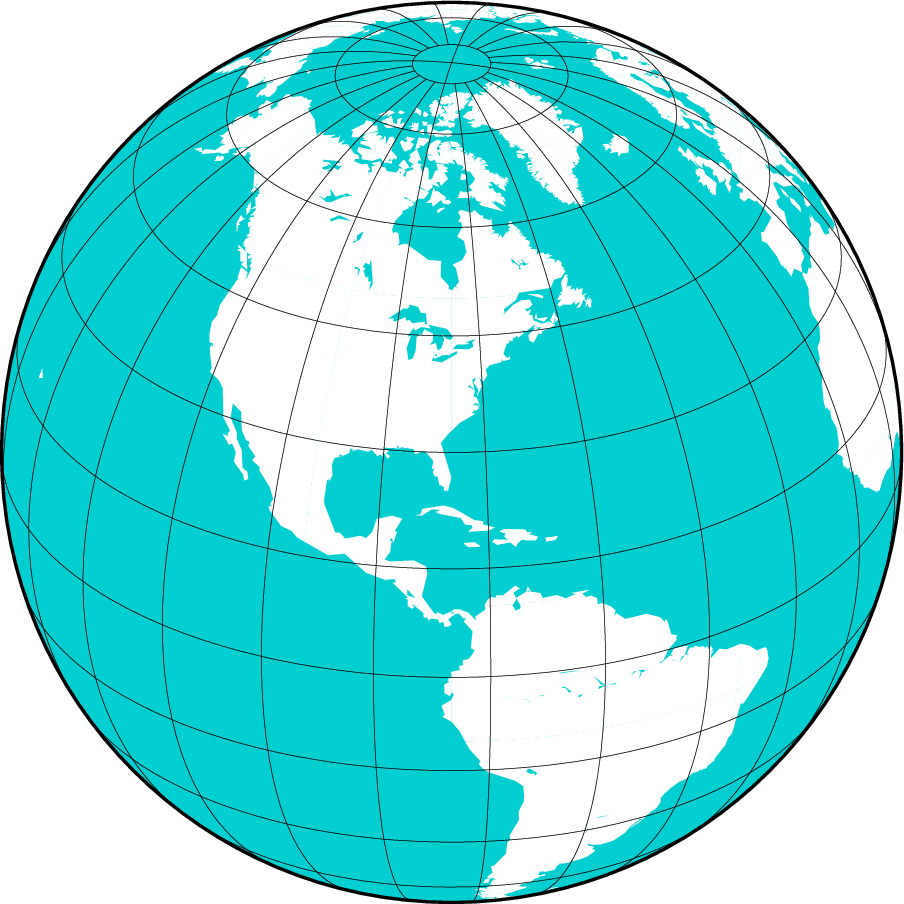
2.4.5. Orthographic projection
The azimuthal orthographic projection (-JG) is one of several projections with similar syntax and behavior; the one we have chosen mimics viewing the Earth from space at an infinite distance; it is neither conformal nor equal-area. The syntax for this projection is
-JGlon_0/lat_0/width
where (lon_0, lat_0) is the center of the map (projection). As an example we will try
gmt pscoast -Rg -JG280/30/6i -Bag -Dc -A5000 -Gwhite -SDarkTurquoise -P > GMT_tut_5.ps
Your plot should look like our example 5 below
Exercises:
- Use the rectangular option in -R to make a rectangular map showing the US only.
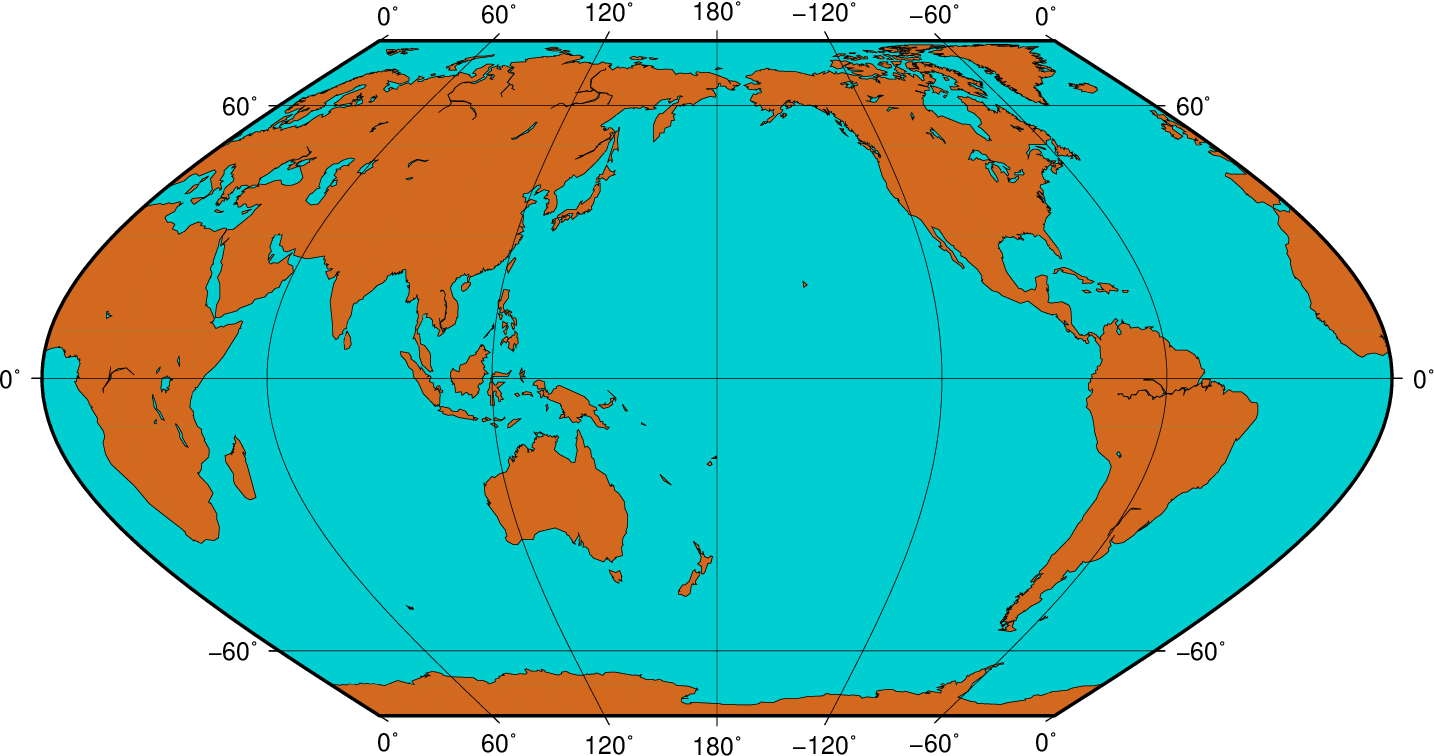
2.4.6. Eckert IV and VI projection
We conclude the survey of map projections with the Eckert IV and VI projections (-JK), two of several projections used for global thematic maps; They are both equal-area projections whose syntax is
-JK[f|s]lon_0/width
where b gives Eckert IV (4) and s (Default) gives Eckert VI (6). The lon_0 is the central meridian (which takes precedence over the mid-value implied by the -R setting). A simple Eckert VI world map is thus generated by
gmt pscoast -Rg -JKs180/9i -Bag -Dc -A5000 -Gchocolate -SDarkTurquoise -Wthinnest > GMT_tut_6.ps
Your plot should look like our example 6 below
Exercises:
- Center the map on Greenwich.
- Add a map scale with -L.
3. Session Two
3.1. General Information
There are 18 GMT modules that directly create (or add overlays to) plots; the remaining 45 are mostly concerned with data processing. This session will focus on the task of plotting lines, symbols, and text on maps. We will build on the skills we acquired while familiarizing ourselves with the various GMT map projections as well as how to select a data domain and boundary annotations.
Program Purpose BASEMAPS psbasemap Create an empty basemap frame with optional scale pscoast Plot coastlines, filled continents, rivers, and political borders pslegend Create legend overlay POINTS AND LINES pswiggle Draw spatial time-series along their (x,y)-tracks psxy Plot symbols, polygons, and lines in 2-D psxyz Plot symbols, polygons, and lines in 3-D HISTOGRAMS pshistogram Plot a rectangular histogram psrose Plot a polar histogram(sector/rose diagram) CONTOURS grdcontour Contouring of 2-D gridded data sets pscontour Direct contouring/imaging of (x,y,z) data by optimal triangulation SURFACES grdimage Produce color images from 2-D gridded data grdvector Plot vector fields from 2-D gridded data grdview 3-D perspective imaging of 2-D gridded data UTILITIES psclip Use polygon files to initiate custom clipping paths psimage Plot Sun raster files psmask Create clipping paths or generate overlay to mask psscale Plot gray scale or color scale bar pstext Plot text strings on maps
Plotting lines and symbols, psxy is one of the most frequently used modules in GMT. In addition to the common command line switches it has numerous specific options, and expects different file formats depending on what action has been selected. These circumstances make psxy harder to master than most GMT tools. The table below shows a abbreviated list of the options:
Option Purpose -A Suppress line interpolation along great circles -Ccpt Let symbol color be determined from z-values and the cpt file -E[x|X][y|Y][+wcap][+ppen] Draw selected error bars with specified attributes -Gfill Set color for symbol or fill for polygons -L[options] Explicitly close polygons or create polygon (see psxy) -N[c|r] Do Not clip symbols at map borders -S[symbol][size] Select one of several symbols -Wpen Set pen for line or symbol outline
The symbols can either be transparent (using -W only, not -G) or solid (-G, with optional outline using -W). The -S option takes the code for the desired symbol and optional size information. If no symbol is given it is expected to be given in the last column of each record in the input file. The size is optional since individual sizes for symbols may also be provided by the input data. The main symbols available to us are shown in the table below:
| Option | Symbol |
|---|---|
| -S-size | horizontal dash; size is length of dash |
| -Sasize | star; size is radius of circumscribing circle |
| -Sbsize[/base][u] | bar; size is bar width, append u if size is in x-units |
| Bar extends from base [0] to the y-value | |
| -Scsize | circle; size is the diameter |
| -Sdsize | diamond; size is its side |
| -Se | ellipse; direction (CCW from horizontal), major, and minor axes |
| are read from the input file | |
| -SE | ellipse; azimuth (CW from vertical), major, and minor axes in kilometers |
| are read from the input file | |
| -Sgsize | octagon; size is its side |
| -Shsize | hexagon; size is its side |
| -Sisize | inverted triangle; size is its side |
| -Sksymbol/size | kustom symbol; size is its side |
| -Slsize+tstring | letter; size is fontsize. The string can be a letter or a text string |
| Append +ffont to set font and +jjust for justification | |
| -Snsize | pentagon; size is its side |
| -Sp | point; no size needed (1 pixel at current resolution is used) |
| -Srsize | rect, width and height are read from input file |
| -Sssize | square, size is its side |
| -Stsize | triangle; size is its side |
| -Svparams | vector; direction (CCW from horizontal) and length are read from input data |
| Append parameters of the vector; see psxy for syntax. | |
| -SVparams | vector, except azimuth (degrees east of north) is expected instead of direction |
| The angle on the map is calculated based on the chosen map projection | |
| -Sw[size] | pie wedge; start and stop directions (CCW from horizontal) are read from |
| input data | |
| -Sxsize | cross; size is length of crossing lines |
| -Sysize | vertical dash; size is length of dash |
The symbol option in psxy. Lower case symbols (a, c, d, g, h, i, n, s, t, x) will fit inside a circle of given diameter. Upper case symbols (A, C, D, G, H, I, N, S, T, X) will have area equal to that of a circle of given diameter.
Because some symbols require more input data than others, and because the size of symbols as well as their color can be determined from the input data, the format of data can be confusing. The general format for the input data is (optional items are in brackets []):
x y [ z ] [ size ] [ sigma_x ] [ sigma_y ] [ symbol ]
Thus, the only required input columns are the first two which must contain the longitude and latitude (or x and y. The remaining items apply when one (or more) of the following conditions are met:
- If you want the color of each symbol to be determined individually, supply a CPT with the -C option and let the 3rd data column contain the z-values to be used with the CPT.
- If you want the size of each symbol to be determined individually, append the size in a separate column.
- To draw error bars, use the -E option and give one or two additional data columns with the dx and dy values; the form of -E determines if one (-Ex or -Ey) or two (-Exy) columns are needed. If upper case flags X or Y are given then we will instead draw a “box-and-whisker” symbol and the sigma_x (or sigma_y) must represent 4 columns containing the minimum, the 25 and 75% quartiles, and the maximum value. The given x (or y) coordinate is taken as the 50% quantile (median).
- If you draw vectors with -Sv (or -SV) then size is actually two columns containing the direction (or azimuth) and length of each vector.
- If you draw ellipses (-Se) then size is actually three columns containing the direction and the major and minor axes in plot units (with -SE we expect azimuth instead and axes lengths in km).
Before we try some examples we need to review two key switches; they specify pen attributes and symbol or polygon fill. Please consult the General Features section the GMT Technical Reference and Cookbook before experimenting with the examples below.
Examples:
We will start off using the file tut_data.txt in your directory. Using the GMT utility gmtinfo we find the extent of the data region:
gmt info @tut_data.txt
which returns
tut_data.txt: N = 7 <1/5> <1/5>
telling us that the file tut_data.txt has 7 records and gives the minimum and maximum values for the first two columns. Given our knowledge of how to set up linear projections with -R and -JX, try the following:
- Plot the data as transparent circles of size 0.3 inches.
- Plot the data as solid white circles instead.
- Plot the data using 0.5” stars, making them red with a thick (width = 1.5p), dashed pen.
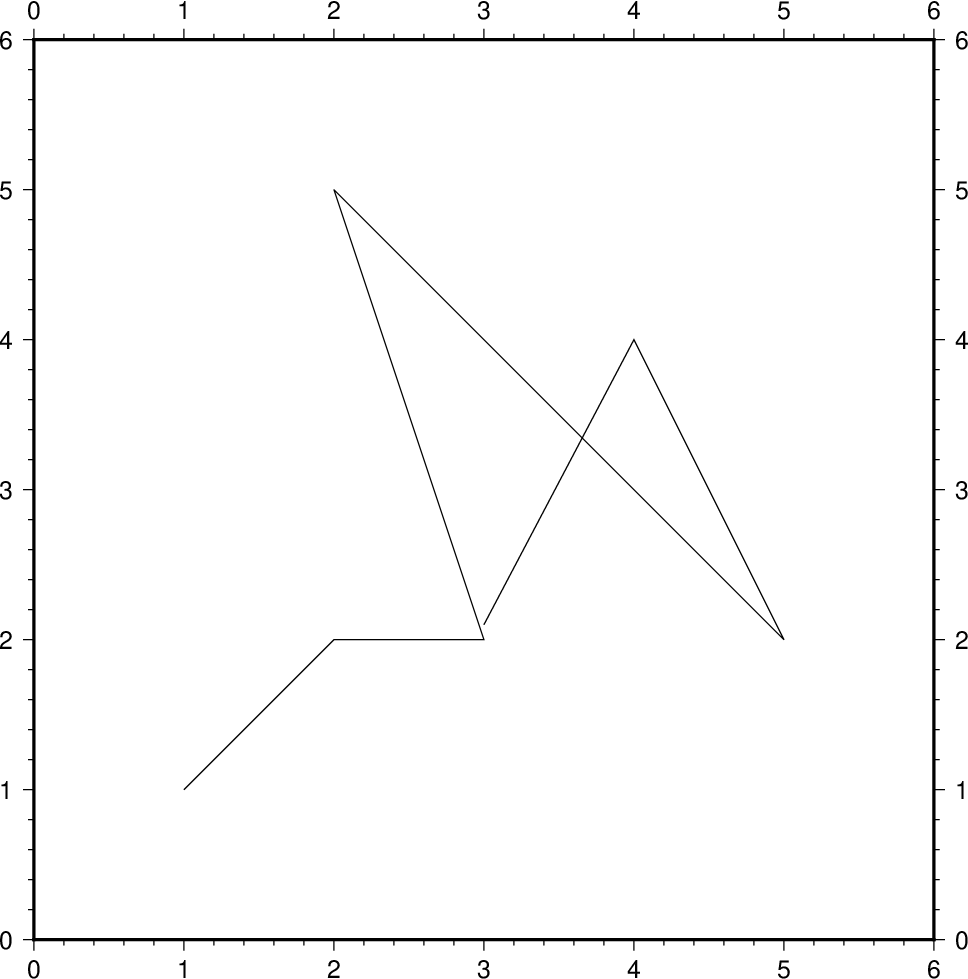
To simply plot the data as a line we choose no symbol and specify a pen thickness instead:
gmt psxy @tut_data.txt -R0/6/0/6 -Jx1i -P -Baf -Wthinner > GMT_tut_7.ps
Your plot should look like our example 7 below
Exercises:
- Plot the data as a green-blue polygon instead.
- Try using a predefined pattern.
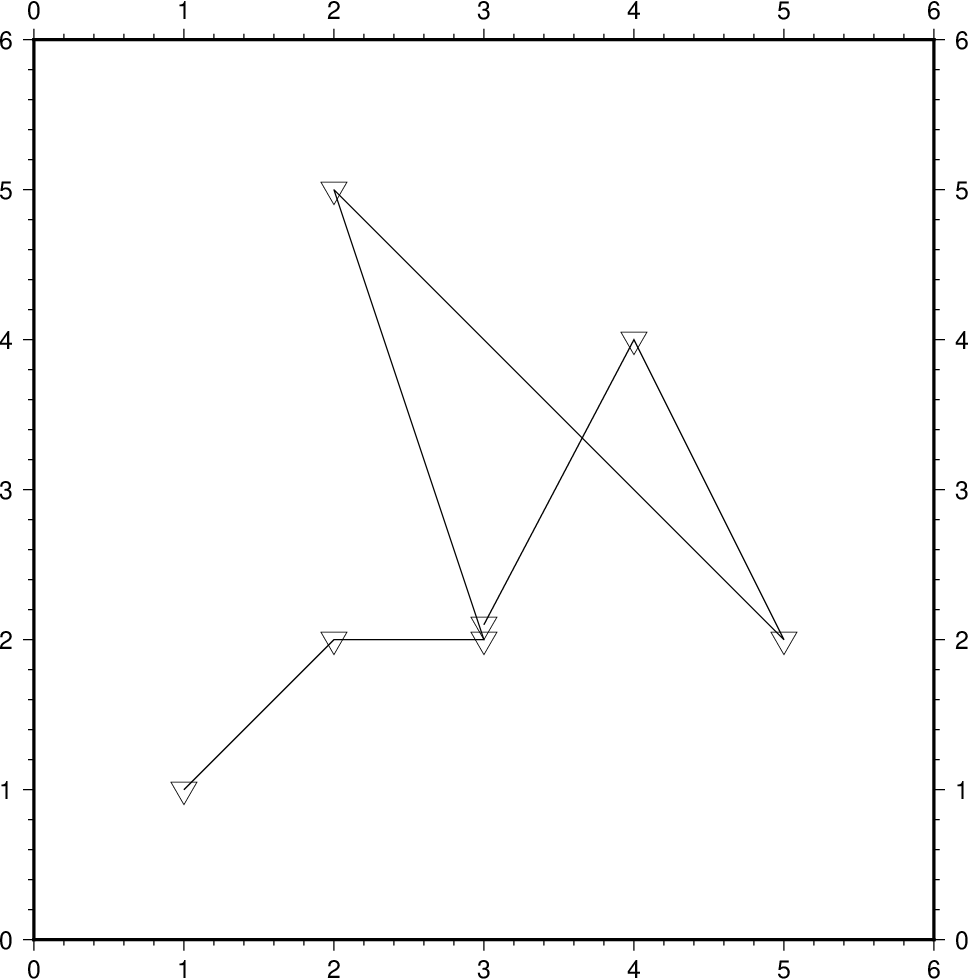
A common question is : “How can I plot symbols connected by a line with psxy?”. The surprising answer is that we must call psxy twice. While this sounds cumbersome there is a reason for this: Basically, polygons need to be kept in memory since they may need to be clipped, hence computer memory places a limit on how large polygons we may plot. Symbols, on the other hand, can be plotted one at the time so there is no limit to how many symbols one may plot. Therefore, to connect symbols with a line we must use the overlay approach:
gmt psxy @tut_data.txt -R0/6/0/6 -Jx1i -Baf -P -K -Wthinner > GMT_tut_8.ps
gmt psxy tut_data.txt -R -J -O -W -Si0.2i >> GMT_tut_8.ps
Your plot should look like our example 8 below. The two-step procedure also makes it easy to plot the line over the symbols instead of symbols over the line, as here.
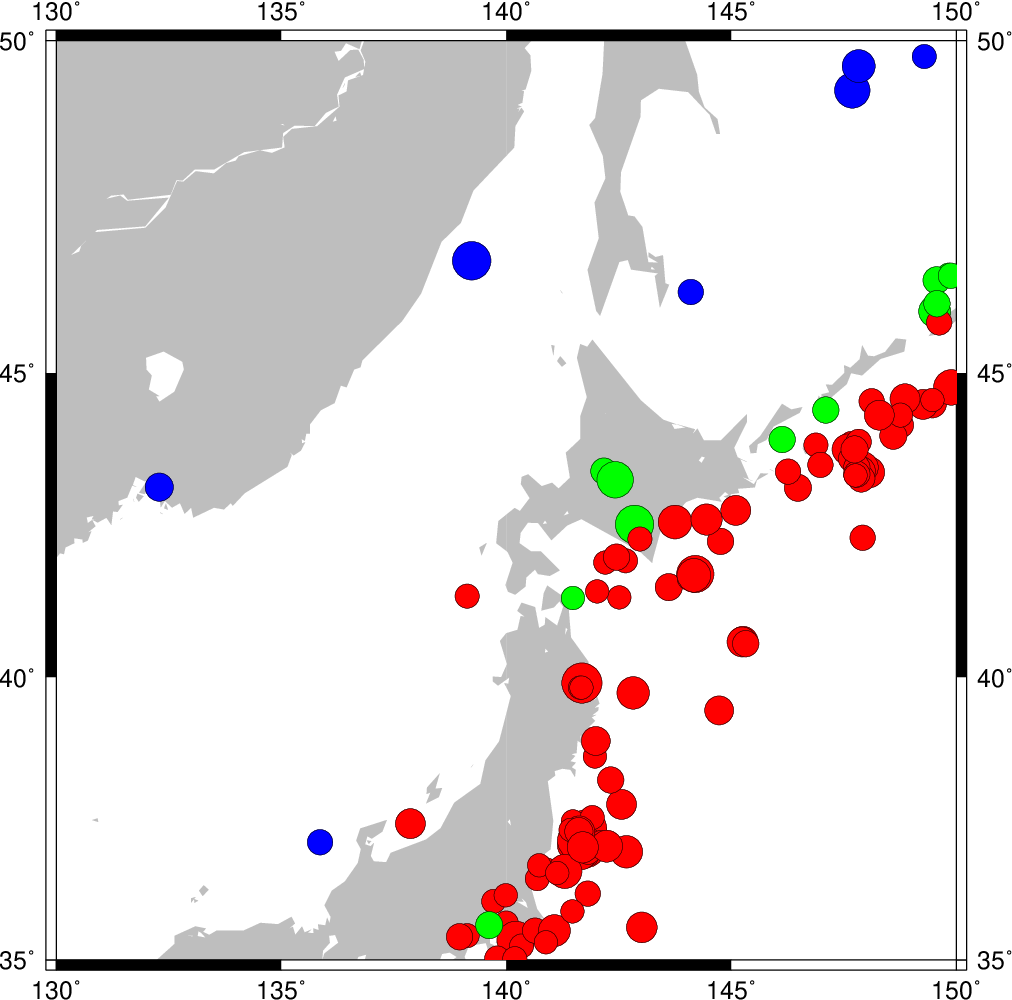
Our final psxy example involves a more complicated scenario in which we want to plot the epicenters of several earthquakes over the background of a coastline basemap. We want the symbols to have a size that reflects the magnitude of the earthquakes, and that their color should reflect the depth of the hypocenter. The first few lines in the tut_quakes.ngdc looks like this:
Historical Tsunami Earthquakes from the NGDC Database
Year  Mo  Da  Lat+N  Long+E  Dep  Mag
1987  01  04  49.77  149.29  489  4.1
1987  01  09  39.90  141.68  067  6.8
Thus the file has three header records (including the blank line), but we are only interested in columns 5, 4, 6, and 7. In addition to extract those columns we must also scale the magnitudes into symbols sizes in inches. Given their range it looks like multiplying the magnitude by 0.1 will work well for symbol sizes in cm. Reformatting this file to comply with the psxy input format can be done in a number of ways, including manual editing, using MATLAB, a spreadsheet program, or UNIX tools. Here, we simply use the common column selection option -i and its scaling/offset capabilities. To skip the first 3 header records and then select the 4th, 3rd, 5th, and 6th column and scale the last column by 0.1, we would use
-i4,3,5,6s0.1 -h3
(Remember that 0 is the first column). We will follow conventional color schemes for seismicity and assign red to shallow quakes (depth 0-100 km), green to intermediate quakes (100-300 km), and blue to deep earthquakes (depth > 300 km). The quakes.cpt file establishes the relationship between depth and color:
# color palette for seismicity
#z0  color   z1 color
0    red    100 red
100  green  300 green
300  blue  1000 blue
Apart from comment lines (starting with #), each record in the CPT governs the color of a symbol whose z value falls in the range between z_0 and z_1. If the colors for the lower and upper levels differ then an intermediate color will be linearly interpolated given the z value. Here, we have chosen constant color intervals. You may wish to consult the Color palette tables section in the Cookbook. This color table was generated as part of the script (below).
We may now complete our example using the Mercator projection:
gmt makecpt -Cred,green,blue -T0,70,300,10000 > quakes.cpt
gmt pscoast -R130/150/35/50 -JM6i -B5 -P -Ggray -K > GMT_tut_9.ps
gmt psxy -R -J -O @tut_quakes.ngdc -Wfaint -i4,3,5,6s0.1 -h3 -Scc -Cquakes.cpt >> GMT_tut_9.ps
where the c appended to the -Sc option ensures that symbols sizes are interpreted to be in cm. Your plot should look like our example 9 below
3.1.1. More exercises
- Select another symbol.
- Let the deep earthquakes be cyan instead of blue.
3.2. Plotting text strings
In many situations we need to annotate plots or maps with text strings; in GMT this is done using pstext. Apart from the common switches, there are 9 options that are particularly useful.
Option Purpose -Cdx/dy Spacing between text and the text box (see -W) -Ddx/dy Offsets the projected location of the strings -Fparams Set font, justify, angle values or source -Gfill Fills the text bos using specified fill -L Lists the font ids and exits -N Deactivates clipping at the borders -Spen Selects outline font and sets pen attributes -Tform Select text box shape -Wpen Draw the outline of text box
The input data to pstext is expected to contain the following information:
[ x y ] [ font] [ angle ] [ justify ] my text
The font is the optional font to use, the angle is the angle (measured counterclockwise) between the text’s baseline and the horizontal, justify indicates which anchor point on the text-string should correspond to the given x, y location, and my text is the text string or sentence to plot. See the Technical reference for the relevant two-character codes used for justification.
The text string can be one or several words and may include octal codes for special characters and escape-sequences used to select subscripts or symbol fonts. The escape sequences that are recognized by GMT are given below:
Code Effect @~ Turns symbol font on or off @+ Turns superscript on or off @- Turns subscript on or off @# Turns small caps on or off @_ Turns underline on or off @%font% Switches to another font; @%% resets to previous font @:size: Switches to another font size; @:: resets to previous size @;color; Switches to another font color; @;; resets to previous color @! Creates one composite character of the next two characters @@ Prints the @ sign itself
Note that these escape sequences (as well as octal codes) can be used anywhere in GMT, including in arguments to the -B option. A chart of octal codes can be found in Appendix F in the GMT Technical Reference. For accented European characters you must set PS_CHAR_ENCODING to ISOLatin1 in your gmt.conf file.
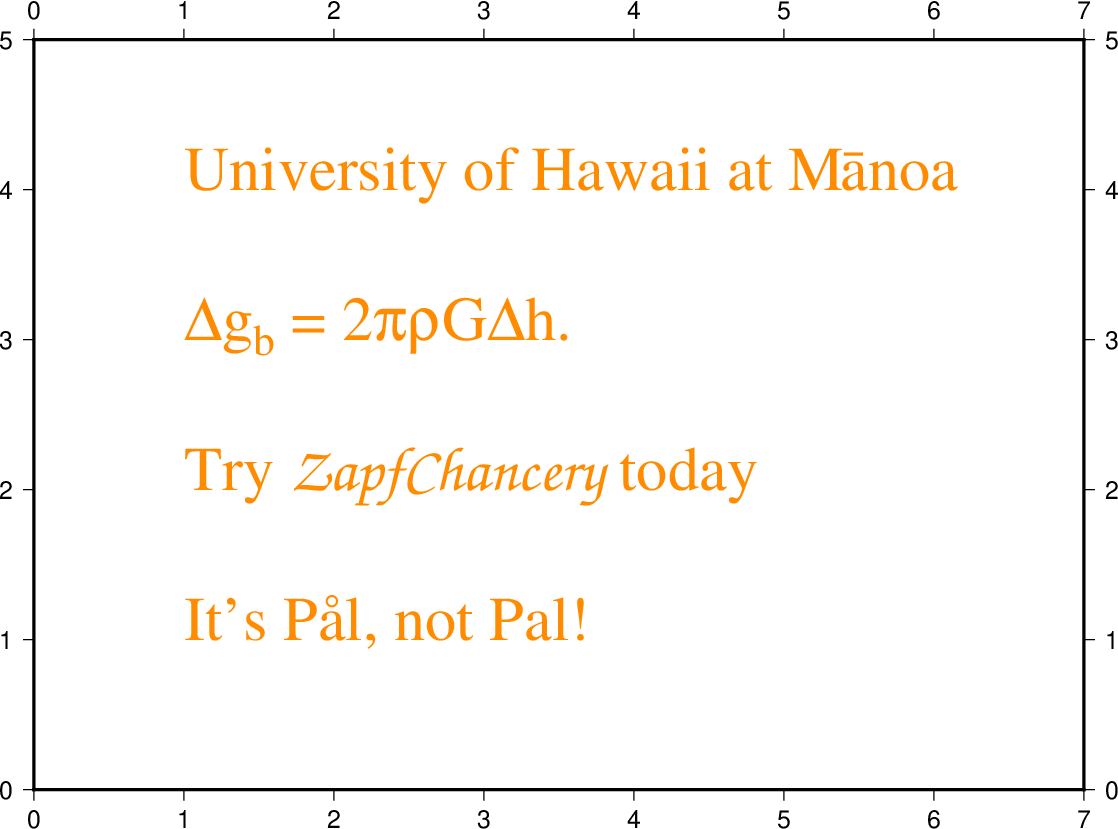
We will demonstrate pstext with the following script:
gmt pstext -R0/7/0/5 -Jx1i -P -Ba -F+f30p,Times-Roman,DarkOrange+jBL << EOF > GMT_tut_10.ps
1  1  It's P@al, not Pal!
1  2  Try @%33%ZapfChancery@%% today
1  3  @~D@~g@-b@- = 2@~pr@~G@~D@~h.
1  4  University of Hawaii at M@!a\225noa
EOF
Here we have used the “here document” notation in UNIX: The << EOF will treat the following lines as the input file until it detects the word EOF. There is nothing magical about the word EOF; you can use any other string like STOP, hellobaby, or IamDone. Your plot should look like our example 10 below
| Code | Effect | Code | Effect |
|---|---|---|---|
| @E | Æ | @e | æ |
| @O | Ø | @o | ø |
| @A | Å | @a | å |
| @C | Ç | @c | ç |
| @N | Ñ | @n | ñ |
| @U | Ü | @u | ü |
| @s | ß |
Exercises:
- At y = 5, add the sentence \(z^2 = x^2 + y^2\).
- At y = 6, add the sentence “It is 32º today”.
4. Session Three
4.1. Contouring gridded data sets
GMT comes with several utilities that can create gridded data sets; we will discuss two such modules later this session. First, we will assume that we already have gridded data sets. Among these data are ETOPO5, crustal ages, gravity and geoid, and DEM for the continental US. Here, we will use grdcut to extract a GMT-ready grid that we will next use for contouring:
gmt grdcut earth_relief_05m.grd -R-66/-60/30/35 -Gtut_bathy.nc -V
Here we use the file extension .nc instead of the generic .grd to indicate that this is a netCDF file. It is good form, but not essential, to use .nc for netCDF grids. Using that extension will help other programs installed on your system to recognize these files and might give it an identifiable icon in your file browser. Learn about other programs that read netCDF files at the netCDF website (http://www.unidata.ucar.edu/software/netcdf/) You can also obtain tut_bathy.nc from the GMT cache server as we are doing below. Feel free to open it in any other program and compare results with GMT.
We first use the GMT module grdinfo to see what’s in this file:
gmt grdinfo @tut_bathy.nc
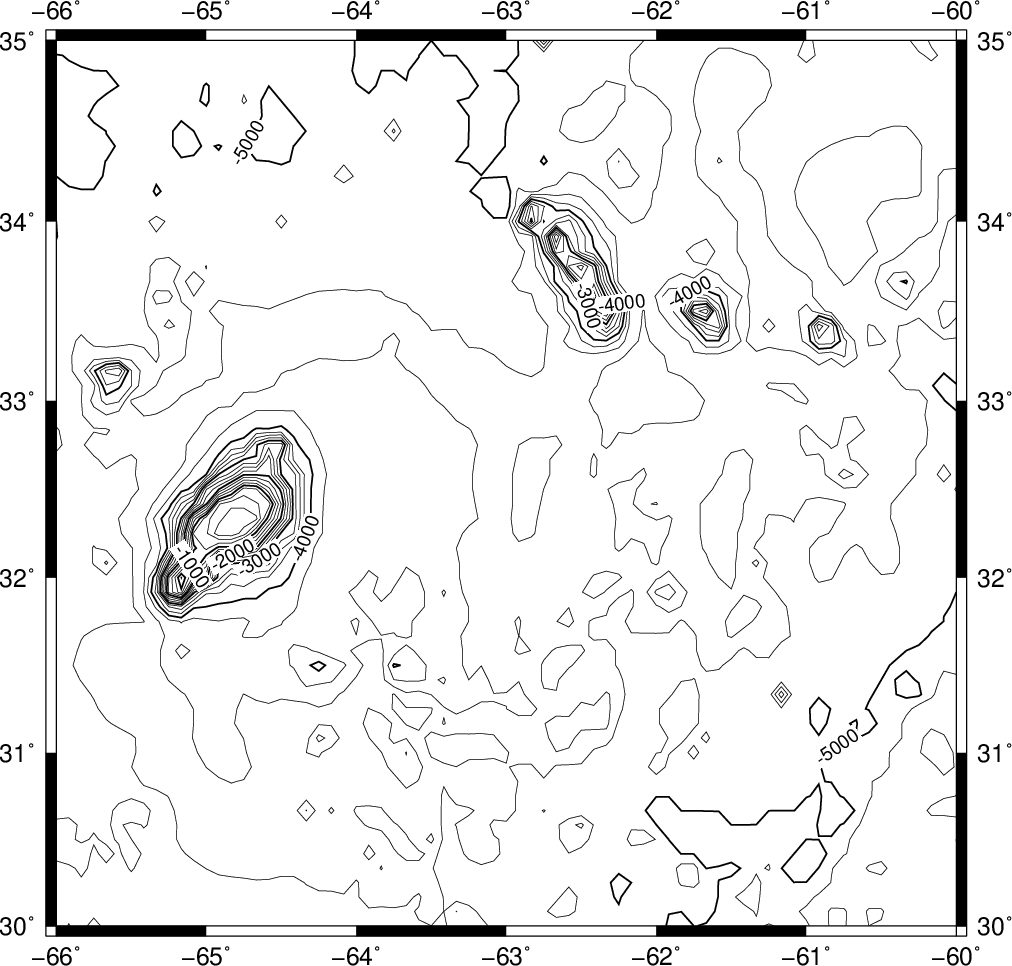
The file contains bathymetry for the Bermuda region and has depth values from -5475 to -89 meters. We want to make a contour map of this data; this is a job for grdcontour. As with previous plot commands we need to set up the map projection with -J. Here, however, we do not have to specify the region since that is by default assumed to be the extent of the grid file. To generate any plot we will in addition need to supply information about which contours to draw. Unfortunately, grdcontour is a complicated module with too many options. We put a positive spin on this situation by touting its flexibility. Here are the most useful options:
Option Purpose -Aannot_int Annotation interval and attributes -Ccont_int Contour interval -Ggap Controls placement of contour annotations -Llow/high Only draw contours within the low to high range -Qcut Do not draw contours with fewer than cut points -Ssmooth Resample contours smooth times per grid cell increment -T[+|-][+dgap[/length]][+l[labels]] Draw tick-marks in downhill direction for innermost closed contours. Add tick spacing and length, and characters to plot at the center of closed contours -W[a|c]pen Set contour and annotation pens -Z[+s *factor*][+ooffset] Subtract offset and multiply data by factor prior to processing
We will first make a plain contour map using 1 km as annotation interval and 250 m as contour interval. We choose a 7-inch-wide Mercator plot and annotate the borders every 2º:
gmt grdcontour @tut_bathy.nc -JM7i -C250 -A1000 -P -Ba > GMT_tut_11.ps
Your plot should look like our example 11 below
Exercises:
- Add smoothing with -S4.
- Try tick all highs and lows with -T.
- Skip small features with -Q10.
- Override region using -R-70/-60/25/35.
- Try another region that clips our data domain.
- Scale data to km and use the km unit in the annotations.
4.2. Gridding of arbitrarily spaced data
Except in the situation above when a grid file is available, we must convert our data to the right format readable by GMT before we can make contour plots and color-coded images. We distinguish between two scenarios:
- The (x, y, z) data are available on a regular lattice grid.
- The (x, y, z) data are distributed unevenly in the plane.
The former situation may require a simple reformatting (using xyz2grd), while the latter must be interpolated onto a regular lattice; this process is known as gridding. GMT supports three different approaches to gridding; here, we will briefly discuss the two most common techniques.
All GMT gridding modules have in common the requirement that the user must specify the grid domain and output filename:
Option Purpose -Rxmin/xmax/ymin/ymax The desired grid extent -Ixinc[yinc] The grid spacing (append m or s for minutes or seconds of arc) -Ggridfile The output grid filename
4.2.1. Nearest neighbor gridding
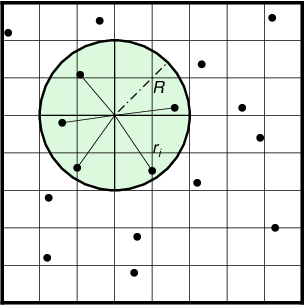
The GMT module nearneighbor implements a simple “nearest neighbor” averaging operation. It is the preferred way to grid data when the data density is high. nearneighbor is a local procedure which means it will only consider the control data that is close to the desired output grid node. Only data points inside a specified search radius will be used, and we may also impose the condition that each of the n sectors must have at least one data point in order to assign the nodal value. The nodal value is computed as a weighted average of the nearest data point per sector inside the search radius, with each point weighted according to its distance from the node. The most important switches are listed below.
Option Purpose -Sradius[u] Sets search radius. Append u for radius in that unit [Default is x-units] -Eempty Assign this value to unconstrained nodes [Default is NaN] -Nsectors Sector search, indicate number of sectors [Default is 4] -W Read relative weights from the 4th column of input data
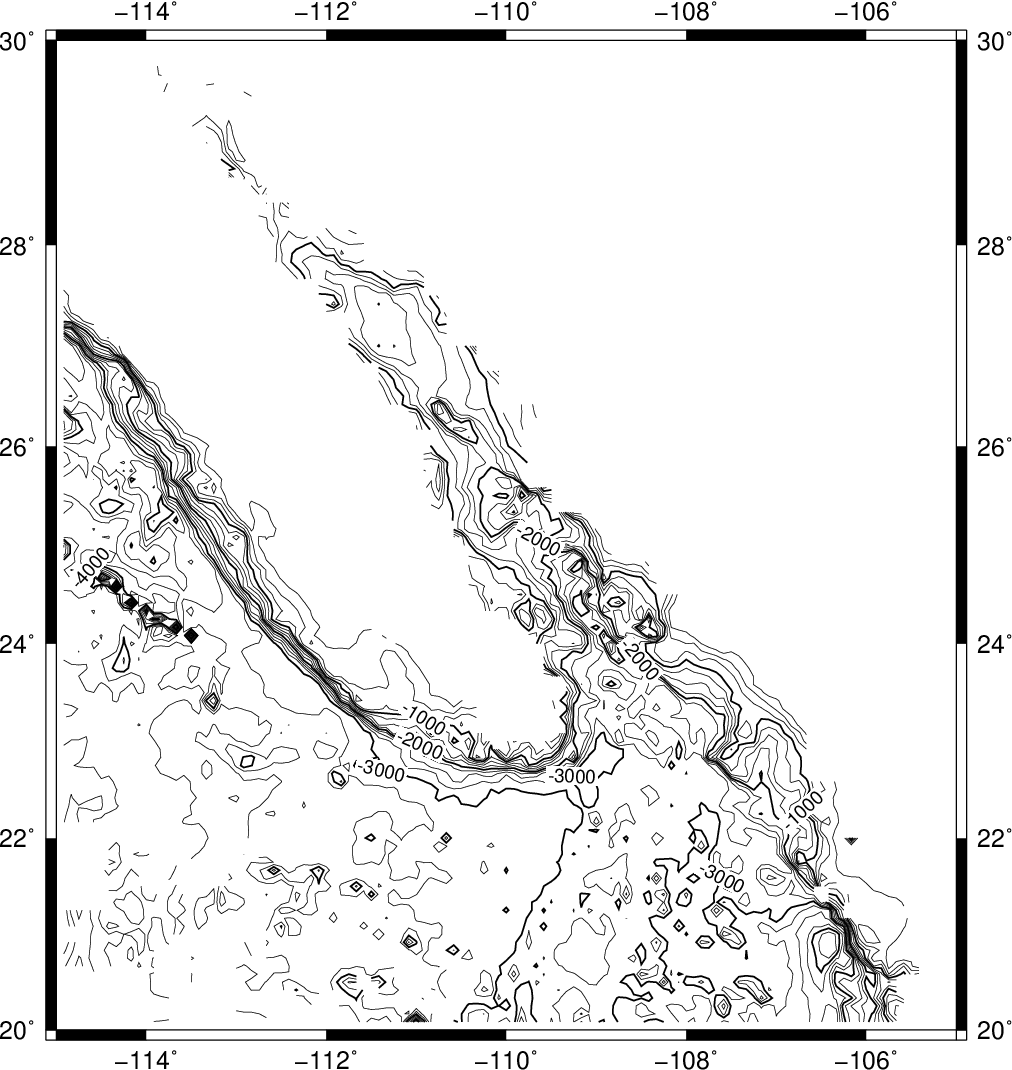
We will grid the data in the file tut_ship.xyz which contains ship observations of bathymetry off Baja California. You can find the file in the sub-directory for example 15. We desire to make a 5’ by 5’ grid. Running gmt info on the file yields
tut_ship.xyz: N = 82970 <245/254.705> <20/29.99131> <-7708/-9>
so we choose the region accordingly, and get a view of the contour map using
gmt nearneighbor -R245/255/20/30 -I5m -S40k -Gship.nc -V @tut_ship.xyz
gmt grdcontour ship.nc -JM6i -P -Ba -C250 -A1000 > GMT_tut_12.ps
Your plot should look like our example 12 below
Since the grid ship.nc is stored in netCDF format that is supported by a host of other modules, you can try one of those as well on the same grid.
Exercises:
- Try using a 100 km search radius and a 10 minute grid spacing.
4.2.2. Gridding with Splines in Tension
As an alternative, we may use a global procedure to grid our data. This approach, implemented in the module surface, represents an improvement over standard minimum curvature algorithms by allowing users to introduce some tension into the surface. Physically, we are trying to force a thin elastic plate to go through all our data points; the values of this surface at the grid points become the gridded data. Mathematically, we want to find the function z(x, y) that satisfies the following equation away from data constraints:
where t is the “tension” in the 0-1 range. Basically, for zero tension we obtain the minimum curvature solution, while as tension goes toward unity we approach a harmonic solution (which is linear in cross-section). The theory behind all this is quite involved and we do not have the time to explain it all here, please see Smith and Wessel [1990] for details. Some of the most important switches for this module are indicated below.
Option Purpose -Aaspect Sets aspect ratio for anisotropic grids. -Climit Sets convergence limit. Default is 1/1000 of data range. -Ttension Sets the tension [Default is 0]
4.3. Preprocessing
The surface module assumes that the data have been preprocessed to eliminate aliasing, hence we must ensure that this step is completed prior to gridding. GMT comes with three preprocessors, called blockmean, blockmedian, and blockmode. The first averages values inside the grid-spacing boxes, the second returns median values, wile the latter returns modal values. As a rule of thumb, we use means for most smooth data (such as potential fields) and medians (or modes) for rough, non-Gaussian data (such as topography). In addition to the required -R and -I switches, these preprocessors all take the same options shown below:
Option Purpose -r Choose pixel node registration [Default is gridline] -W[i|o] Append i or o to read or write weights in the 4th column
With respect to our ship data we preprocess it using the median method:
gmt blockmedian -R245/255/20/30 -I5m -V @tut_ship.xyz > ship_5m.xyz
The output data can now be used with surface:
gmt surface ship_5m.xyz -R245/255/20/30 -I5m -Gship.nc -V
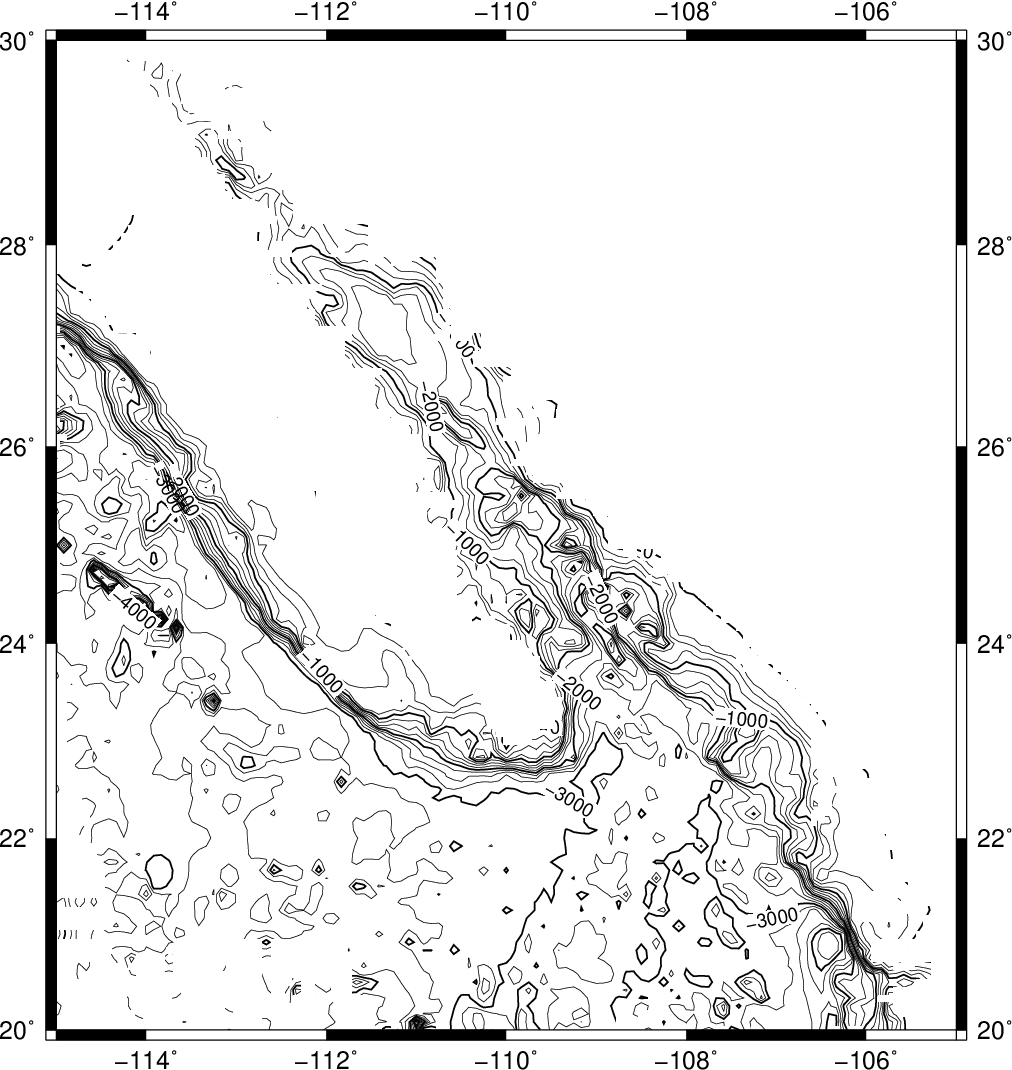
If you rerun grdcontour on the new grid file (try it!) you will notice a big difference compared to the grid made by nearneighbor: since surface is a global method it will evaluate the solution at all nodes, even if there are no data constraints. There are numerous options available to us at this point:
- We can reset all nodes too far from a data constraint to the NaN value.
- We can pour white paint over those regions where contours are unreliable.
- We can plot the landmass which will cover most (but not all) of the unconstrained areas.
- We can set up a clip path so that only the contours in the constrained region will show.
Here we have only time to explore the latter approach. The psmask module can read the same preprocessed data and set up a contour mask based on the data distribution. Once the clip path is activated we can contour the final grid; we finally deactivate the clipping with a second call to psmask. Here’s the recipe:
gmt psmask -R245/255/20/30 -I5m ship_5m.xyz -JM6i -Ba -P -K -V > GMT_tut_13.ps
gmt grdcontour ship.nc -J -O -K -C250 -A1000 >> GMT_tut_13.ps
gmt psmask -C -O >> GMT_tut_13.ps
Your plot should look like our example 13 below
Exercises:
- Add the continents using any color you want.
- Color the clip path light gray (use -G in the first psmask call).
5. Session Four
In our final session we will concentrate on color images and perspective views of gridded data sets. Before we start that discussion we need to cover three important aspects of plotting that must be understood. These are
- Color tables and pseudo-colors in GMT.
- Artificial illumination and how it affects colors.
- Multi-dimensional grids.
5.1. CPTs
The CPT is discussed in detail in the GMT Technical Reference and Cookbook. Please review the format before experimenting further.
CPTs can be created in any number of ways. GMT provides two mechanisms:
- Create simple, linear color tables given a master color table (several are built-in) and the desired z-values at color boundaries (makecpt)
- Create color tables based on a master CPT color table and the histogram-equalized distribution of z-values in a gridded data file (grd2cpt)
One can also make these files manually or with awk or other tools. Here we will limit our discussion to makecpt. Its main argument is the name of the master color table (a list is shown if you run the module with no arguments) and the equidistant z-values to go with it. The main options are given below.
Option Purpose -C Set the name of the master CPT to use -I Reverse the sense of the color progression -V Run in verbose mode -Z Make a continuous rather than discrete table
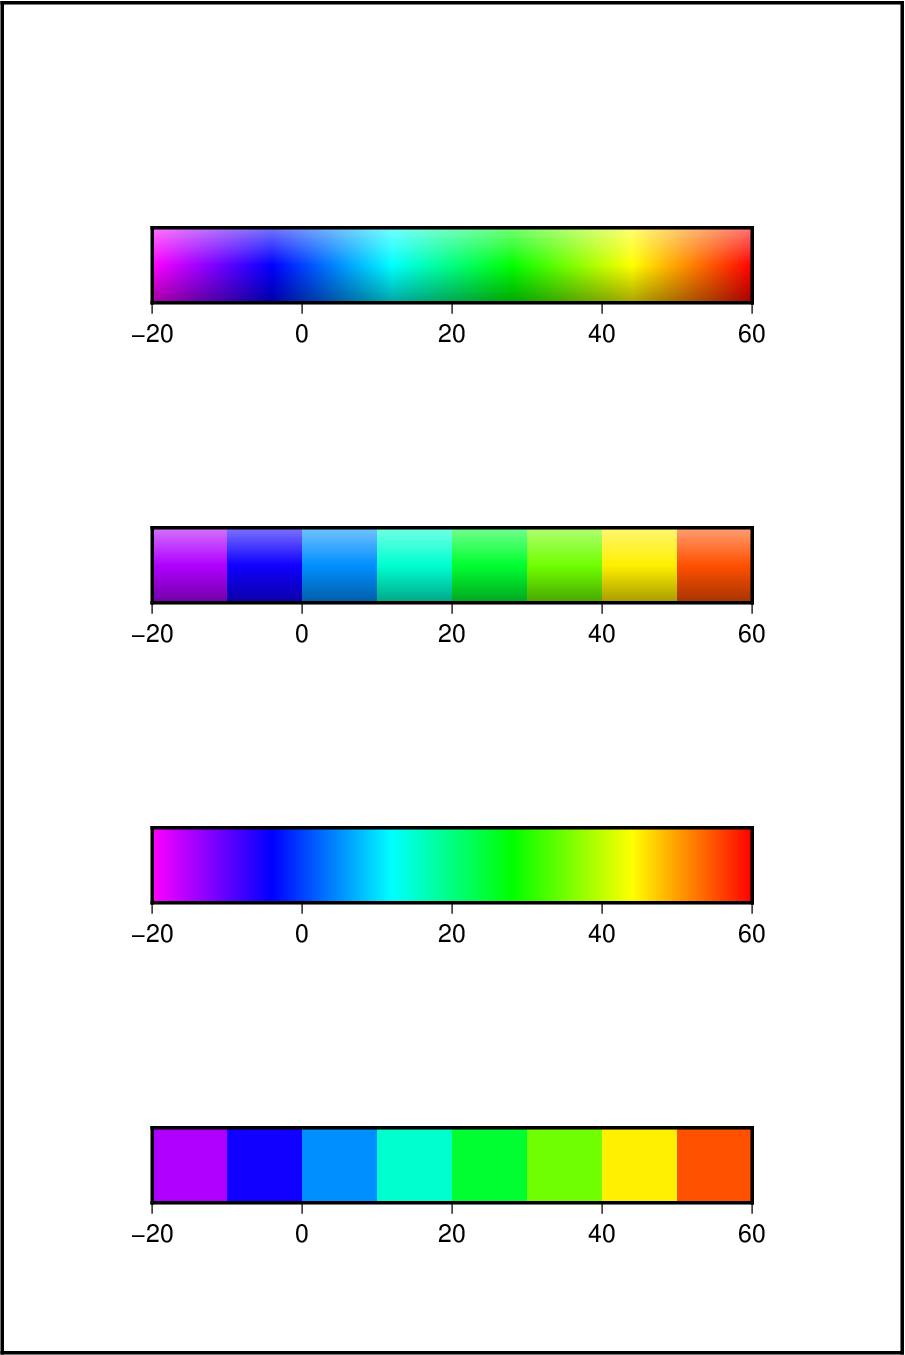
To make discrete and continuous color CPTs for data that ranges from -20 to 60, with color changes at every 10, try these two variants:
gmt makecpt -Crainbow -T-20/60/10 > disc.cpt
gmt makecpt -Crainbow -T-20/60/10 -Z > cont.cpt
We can plot these color tables with psscale; the options worth mentioning here are listed below. The placement of the color bar is particularly important and we refer you to the Plot embellishments section for all the details. In addition, the -B option can be used to set the title and unit label (and optionally to set the annotation-, tick-, and grid-line intervals for the color bars.)
Option Purpose -Ccpt The required CPT -Dxxpos/ypos+wlength/width[+h] Sets the position and dimensions of scale bar. Append +h to get horizontal bar -Imax_intensity Add illumination effects
Here is an example of four different ways of presenting the color bar:
gmt psbasemap -R0/6/0/9 -Jx1i -P -B0 -K -Xc > GMT_tut_14.ps
gmt psscale -Dx1i/1i+w4i/0.5i+h -Cdisc.cpt -B+tdiscrete -O -K >> GMT_tut_14.ps
gmt psscale -Dx1i/3i+w4i/0.5i+h -Ccont.cpt -B+tcontinuous -O -K >> GMT_tut_14.ps
gmt psscale -Dx1i/5i+w4i/0.5i+h -Cdisc.cpt -B+tdiscrete -I0.5 -O -K >> GMT_tut_14.ps
gmt psscale -Dx1i/7i+w4i/0.5i+h -Ccont.cpt -B+tcontinuous -I0.5 -O >> GMT_tut_14.ps
Your plot should look like our example 14 below
Exercises:
- Redo the makecpt exercise using the master table hot and redo the bar plot.
- Try specifying -B10g5.
5.2. Illumination and intensities
GMT allows for artificial illumination and shading. What this means is that we imagine an artificial sun placed at infinity in some azimuth and elevation position illuminating our surface. The parts of the surface that slope toward the sun should brighten while those sides facing away should become darker; no shadows are cast as a result of topographic undulations.
While it is clear that the actual slopes of the surface and the orientation of the sun enter into these calculations, there is clearly an arbitrary element when the surface is not topographic relief but some other quantity. For instance, what does the slope toward the sun mean if we are plotting a grid of heat flow anomalies? While there are many ways to accomplish what we want, GMT offers a relatively simple way: We may calculate the gradient of the surface in the direction of the sun and normalize these values to fall in the -1 to +1 range; +1 means maximum sun exposure and -1 means complete shade. Although we will not show it here, it should be added that GMT treats the intensities as a separate data set. Thus, while these values are often derived from the relief surface we want to image they could be separately observed quantities such as back-scatter information.
Colors in GMT are specified in the RGB system used for computer screens; it mixes red, green, and blue light to achieve other colors. The RGB system is a Cartesian coordinate system and produces a color cube. For reasons better explained in Appendix I in the Reference book it is difficult to darken and brighten a color based on its RGB values and an alternative coordinate system is used instead; here we use the HSV system. If you hold the color cube so that the black and white corners are along a vertical axis, then the other 6 corners project onto the horizontal plane to form a hexagon; the corners of this hexagon are the primary colors Red, Yellow, Green, Cyan, Blue, and Magenta. The CMY colors are the complimentary colors and are used when paints are mixed to produce a new color (this is how printers operate; they also add pure black (K) to avoid making gray from CMY). In this coordinate system the angle 0-360º is the hue (H); the Saturation and Value are harder to explain. Suffice it to say here that we intend to darken any pure color (on the cube facets) by keeping H fixed and adding black and brighten it by adding white; for interior points in the cube we will add or remove gray. This operation is efficiently done in the HSV coordinate system; hence all GMT shading operations involve translating from RGB to HSV, do the illumination effect, and transform back the modified RGB values.
5.3. Color images
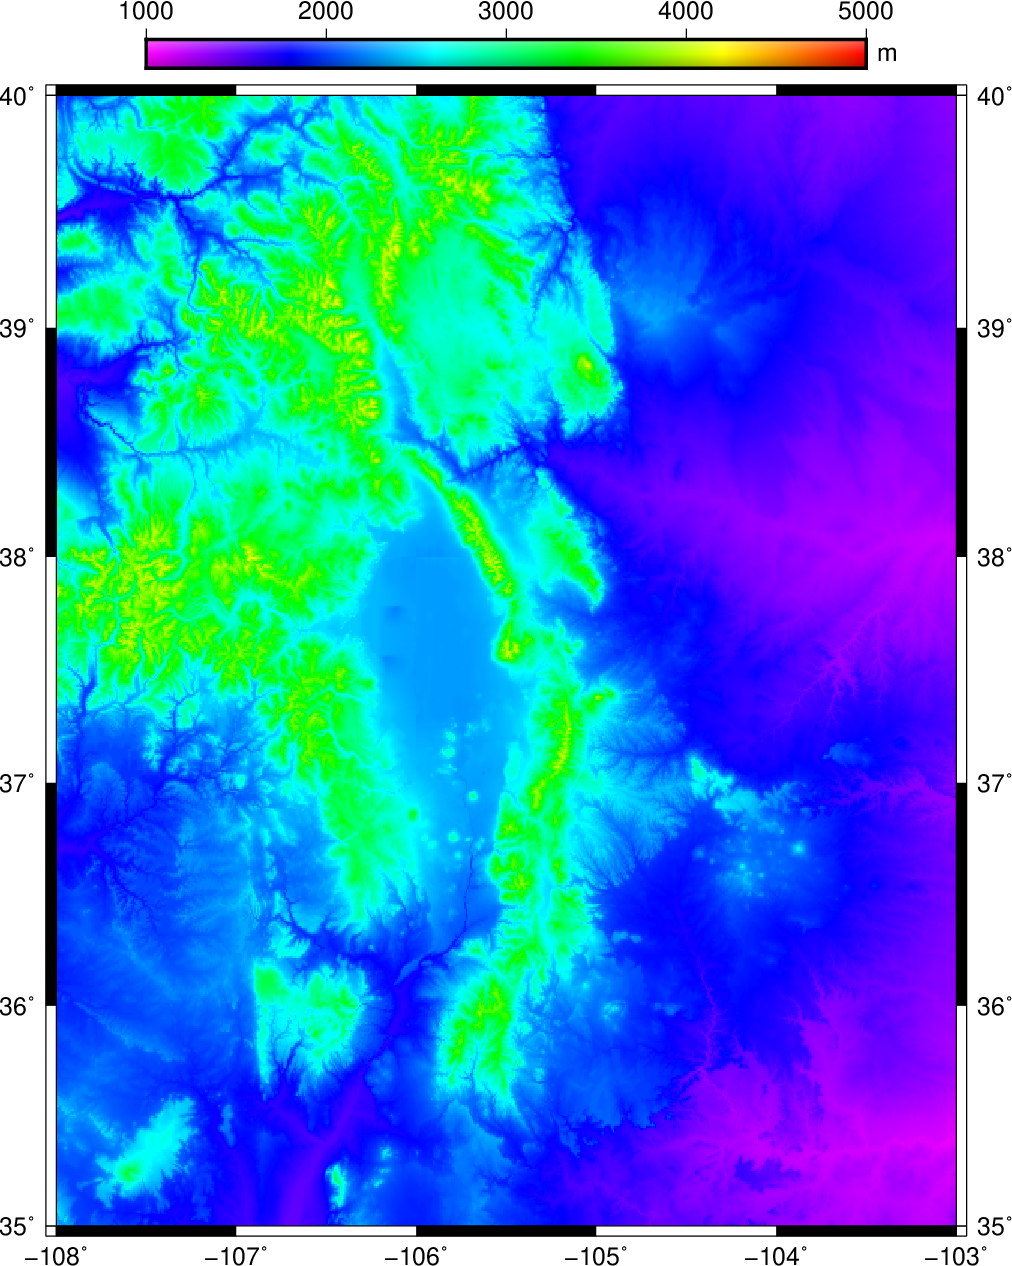
Once a CPT has been made it is relatively straightforward to generate a color image of a gridded data. Here, we will extract a subset of the global 30” DEM called SRTM30+:
gmt grdcut earth_relief_30s.grd -R-108/-103/35/40 -Gtut_relief.nc
Using grdinfo we find that the data ranges from about 1000m to about 4300m so we make a CPT accordingly:
gmt makecpt -Crainbow -T1000/5000/500 -Z > topo.cpt
Color images are made with grdimage which takes the usual common command options (by default the -R is taken from the data set) and a CPT; the main other options are:
Option Purpose -Edpi Sets the desired resolution of the image [Default is data resolution] -Iintenfile Use artificial illumination using intensities from intensfile -M Force gray shade using the (television) YIQ conversion
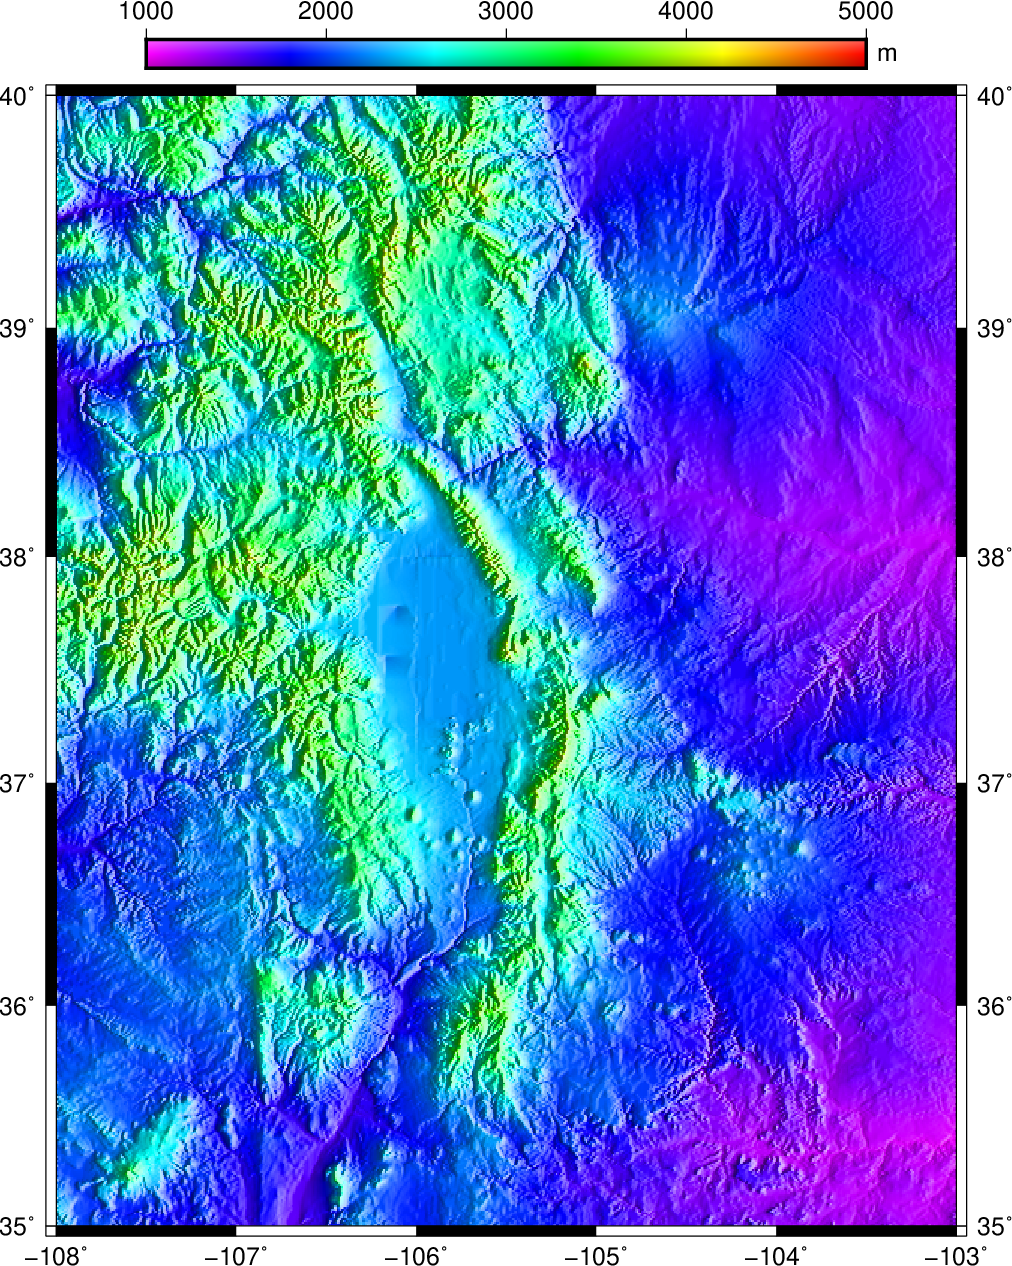
We want to make a plain color map with a color bar superimposed above the plot. We try
gmt grdimage @tut_relief.nc -JM6i -P -Ba -Ctopo.cpt -V -K > GMT_tut_15.ps
gmt psscale -DjTC+w5i/0.25i+h+o0/-1i -Rtut_relief.nc -J -Ctopo.cpt -I0.4 -By+lm -O >> GMT_tut_15.ps
Your plot should look like our example 15 below
The plain color map lacks detail and fails to reveal the topographic complexity of this Rocky Mountain region. What it needs is artificial illumination. We want to simulate shading by a sun source in the east, hence we derive the required intensities from the gradients of the topography in the N90ºE direction using grdgradient. Other than the required input and output filenames, the available options are
Option Purpose -Aazimuth Azimuthal direction for gradients -fg Indicates that this is a geographic grid -N[t|e][+snorm][+ooffset] Normalize gradients by norm/offset [= 1/0 by default]. Insert t to normalize by the inverse tangent transformation. Insert e to normalize by the cumulative Laplace distribution.
The GMT inverse tangent transformation shows that raw slopes from bathymetry tend to be far from normally distributed (left). By using the inverse tangent transformation we can ensure a more uniform distribution (right). The inverse tangent transform simply takes the raw slope estimate (the x value at the arrow) and returns the corresponding inverse tangent value (normalized to fall in the plus/minus 1 range; horizontal arrow pointing to the y-value).

How the inverse tangent operation works. Raw slope values (left) are processed via the inverse tangent operator, turning tan(x) into x and thus compressing the data range. The transformed slopes are more normally distributed (right).
-Ne and -Nt yield well behaved gradients. Personally, we prefer to use the -Ne option; the value of norm is subjective and you may experiment somewhat in the 0.5-5 range. For our case we choose
gmt grdgradient @tut_relief.nc -Ne0.8 -A100 -fg -Gus_i.nc
Given the CPT and the two gridded data sets we can create the shaded relief image:
gmt grdimage @tut_relief.nc -Ius_i.nc -JM6i -P -Ba -Ctopo.cpt -K > GMT_tut_16.ps
gmt psscale -DjTC+w5i/0.25i+h+o0/-1i -Rtut_relief.nc -J -Ctopo.cpt -I0.4 -By+lm -O >> GMT_tut_16.ps
Your plot should look like our example 16 below
Exercises:
- Force a gray-shade image.
- Rerun grdgradient with -N1.
5.4. Multi-dimensional maps
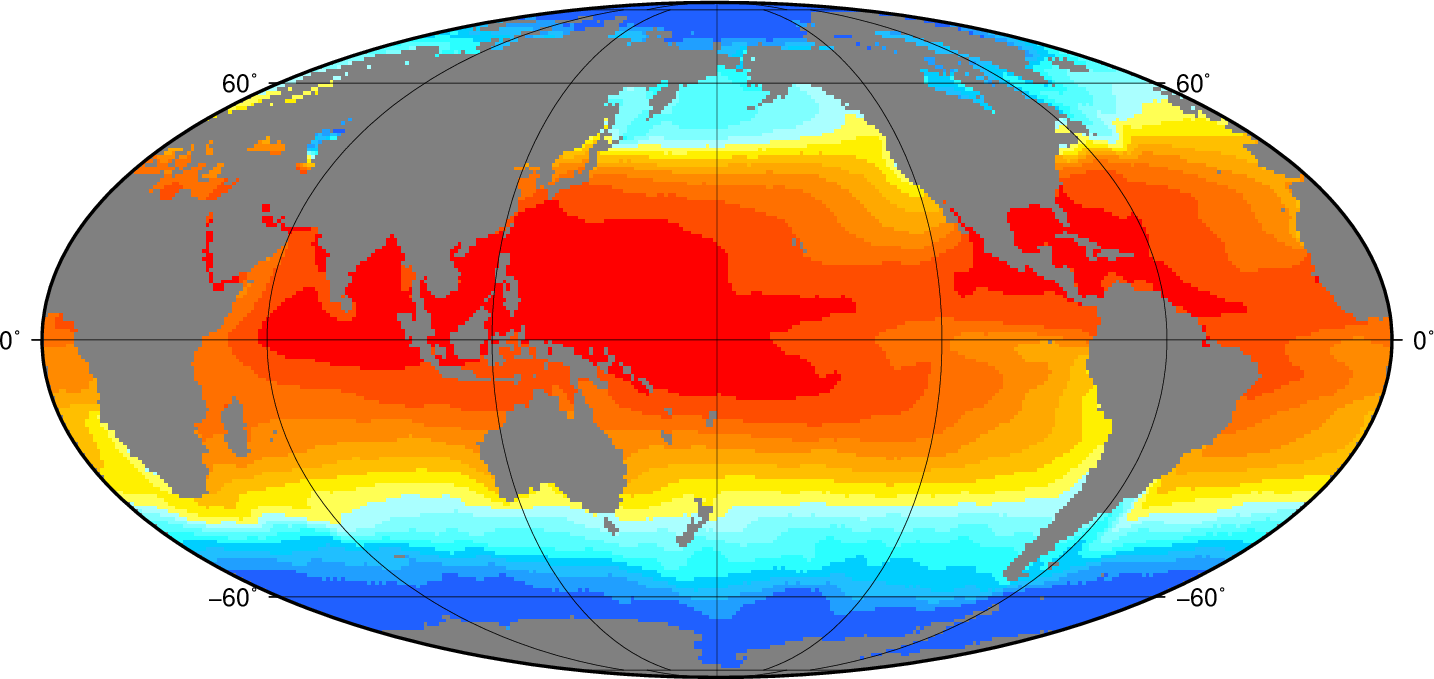
Climate data, like ocean temperatures or atmospheric pressure, are often provided as multi-dimensional (3-D, 4-D or 5-D) grids in netCDF format. This section will demonstrate that GMT is able to plot “horizontal” slices (spanning latitude and longitude) of such grids without much effort.
As an example we will download the Seasonal Analysed Mean Temperature from the World Ocean Atlas 1998 (http://www.cdc.noaa.gov/cdc/data.nodc.woa98.html). The file in question is named otemp.anal1deg.nc (ftp://ftp.cdc.noaa.gov/Datasets/nodc.woa98/temperat/seasonal/otemp.anal1deg.nc).
You can look at the information pertained in this file using the program ncdump and notice that the variable that we want to plot (otemp) is a four-dimensional variable of time, level (i.e., depth), latitude and longitude.
ncdump -h otemp.anal1deg.nc
We will need to make an appropriate color scale, running from -2ºC (freezing temperature of salt water) to 30ºC (highest likely ocean temperature). We do this as follows:
gmt makecpt -Cno_green -T-2/30/2 > otemp.cpt
Let us focus on the temperatures in Summer (that is the third season, July through September) at sea level (that is the first level). To plot these in a Mollweide projection we use:
gmt grdimage -Rg -JW180/9i "@otemp.anal1deg.nc?otemp[2,0]" -Cotemp.cpt -Bag > GMT_tut_17.ps
The addition “?otemp[2,0]” indicates which variable to retrieve from the netCDF file (otemp) and that we need the third time step and first level. The numbering of the time steps and levels starts at zero, therefore “[2,0]”. Make sure to put the whole file name within quotes since the characters ?, [ and ] have special meaning in Unix. Your plot should look like our example 17 below
Exercises:
- Plot the temperatures for Spring at 5000 m depth. (Hint: use ncdump -v level to figure out what level number that is).
- Include a color scale at the bottom of the plot.
5.5. Perspective views
Our final undertaking in this tutorial is to examine three-dimensional perspective views. The GMT module that produces perspective views of gridded data files is grdview. It can make two kinds of plots:
- Mesh or wire-frame plot (with or without superimposed contours)
- Color-coded surface (with optional shading, contours, or draping).
Regardless of plot type, some arguments must be specified; these are
- relief_file; a gridded data set of the surface.
- -J for the desired map projection.
- -JZheight for the vertical scaling.
- -pazimuth/elevation for the vantage point.
In addition, some options may be required:
Option Purpose -Ccpt The cpt is required for color-coded surfaces and for contoured mesh plots -Gdrape_file Assign colors using drape_file instead of relief_file -Iintens_file File with illumination intensities -Qm Selects mesh plot -Qs[+m] Surface plot using polygons; append +m to show mesh. This option allows for -W -Qidpi[g] Image by scan-line conversion. Specify dpi; append g to force gray-shade image. -B is disabled. -Wpen Draw contours on top of surface (except with -Qi)
5.5.1. Mesh-plot
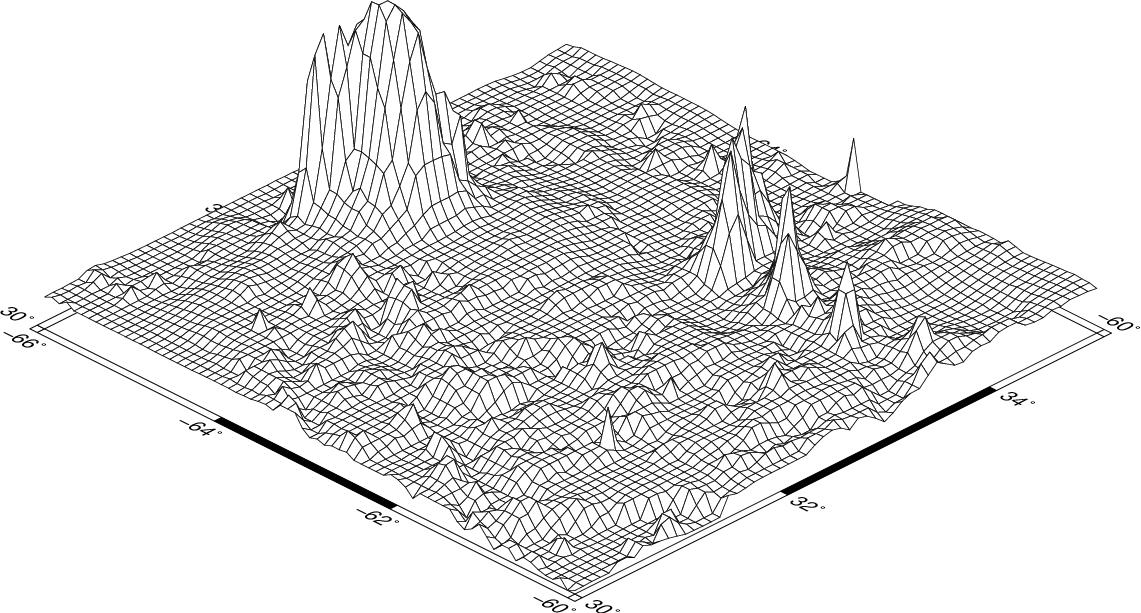
Mesh plots work best on smaller data sets. We again use the small subset of the ETOPO5 data over Bermuda and make a quick-and-dirty CPT:
gmt grd2cpt @tut_bathy.nc -Cocean > bermuda.cpt
A simple mesh plot can therefore be obtained with
gmt grdview @tut_bathy.nc -JM5i -P -JZ2i -p135/30 -Ba -Cbermuda.cpt > GMT_tut_18.ps
Your plot should look like our example 18 below
Exercises:
- Select another vantage point and vertical height.
5.5.2. Color-coded view
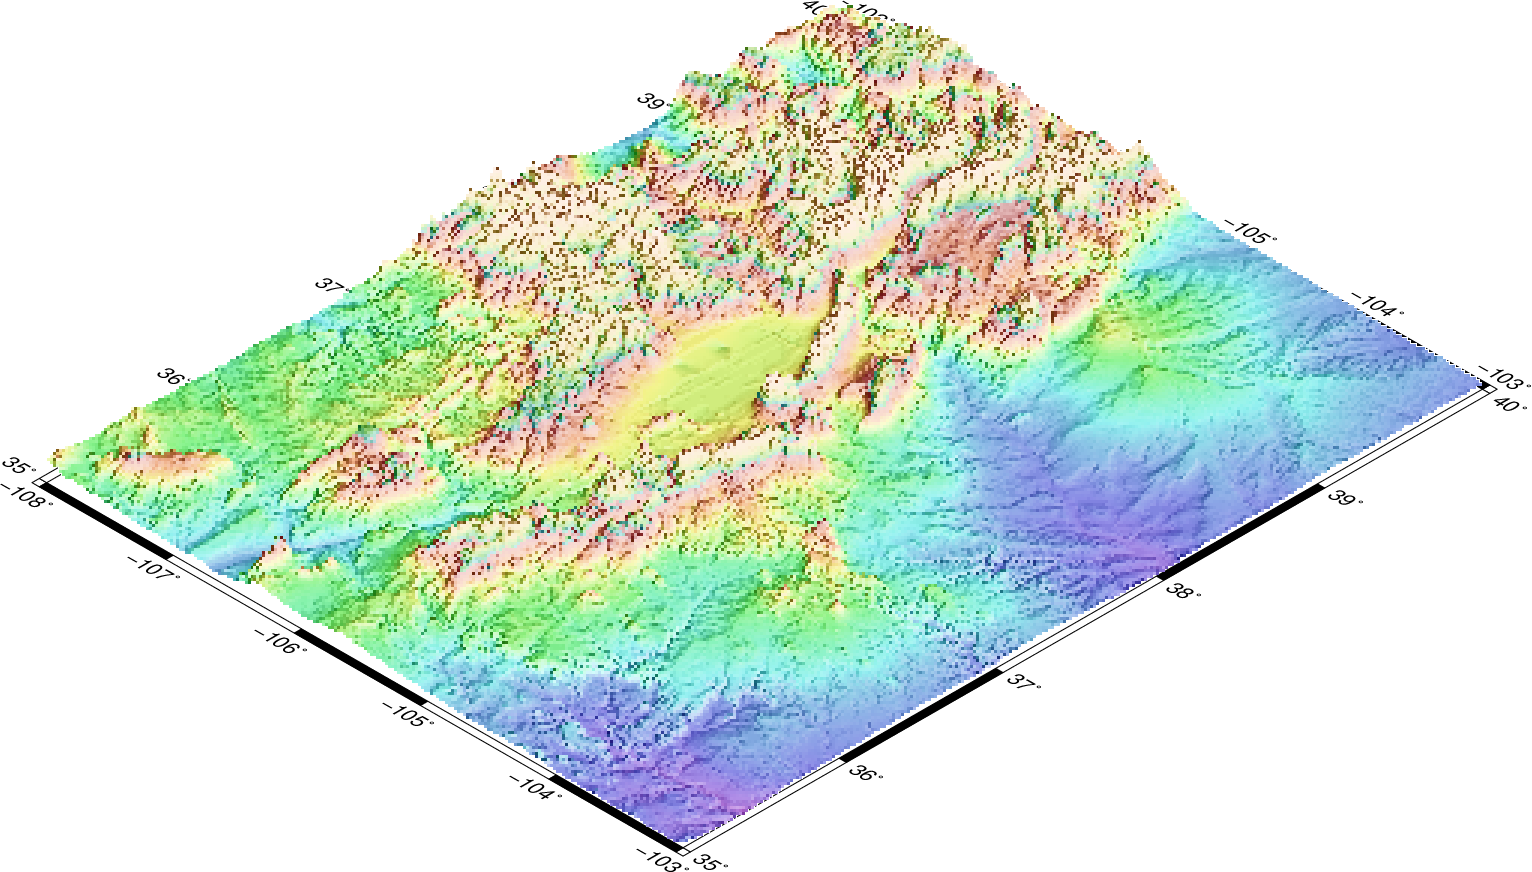
We will make a perspective, color-coded view of the US Rockies from the southeast. This is done using
gmt grdview @tut_relief.nc -JM6i -p135/35 -Qi50 -Ius_i.nc -Ctopo.cpt -V -Ba -JZ0.5i > GMT_tut_19.ps
Your plot should look like our example 19 below
This plot is pretty crude since we selected 50 dpi but it is fast to render and allows us to try alternate values for vantage point and scaling. When we settle on the final values we select the appropriate dpi for the final output device and let it rip.
Exercises:
- Choose another vantage point and scaling.
- Redo grdgradient with another illumination direction and plot again.
- Select a higher dpi, e.g., 200.
