(10) A geographical bar graph plot
Our next and perhaps most business-like example presents a three-dimensional bar graph plot showing the geographic distribution of all the languages of the world. The input data was taken from Ethnologue. We decide to plot a 3-D multi-band column centered on each continent with a height that is proportional to the languages used. We choose a plain linear projection for the basemap and add the multi-band columns and text on top. The different bands in the columns indicate how commonly the languages are used, from institutional languages to languages threatened by extinction. We use gmtmath to sum up the total languages per continent. The script also shows how to effectively use transparency of the boxes around the numbers and in the shade surrounding the legend. Our script that produces Figure 10 reads:
#!/usr/bin/env bash
#		GMT EXAMPLE 10
#
# Purpose:	Make 3-D bar graph on top of perspective map
# GMT modules:	coast, text, plot3d, legend, makecpt, math
#
gmt begin ex10
	gmt coast -Rd -JQ0/37.5/20c -Sazure2 -Gwheat -Wfaint -A5000 -p200/40
	gmt makecpt -Cpurple,blue,darkgreen,yellow,red -T0,1,2,3,4,5
	gmt math -T @languages_10.txt -o0:2 -C2 3 COL ADD 4 COL ADD 5 COL ADD 6 COL ADD = \
		| gmt text -p -Gwhite@30 -D-0.6c/0 -F+f30p,Helvetica-Bold,firebrick=thinner+jRM+z
	gmt plot3d @languages_10.txt -R-180/180/-90/90/0/2500 -JZ6c -So0.75c+Z5 -C -Wthinner \
		--FONT_TITLE=30p,Times-Bold --MAP_TITLE_OFFSET=-2c -p --FORMAT_GEO_MAP=dddF \
		-B -Bza500+lLanguages -BWSneZ+t"World Languages By Continent"
	gmt legend -JZ -DjLB+o0.5c+w3.5c/0+jBL --FONT=Helvetica-Bold \
		-F+glightgrey+pthinner+s-4p/-6p/grey20@40 -p @legend_10.txt
gmt end show
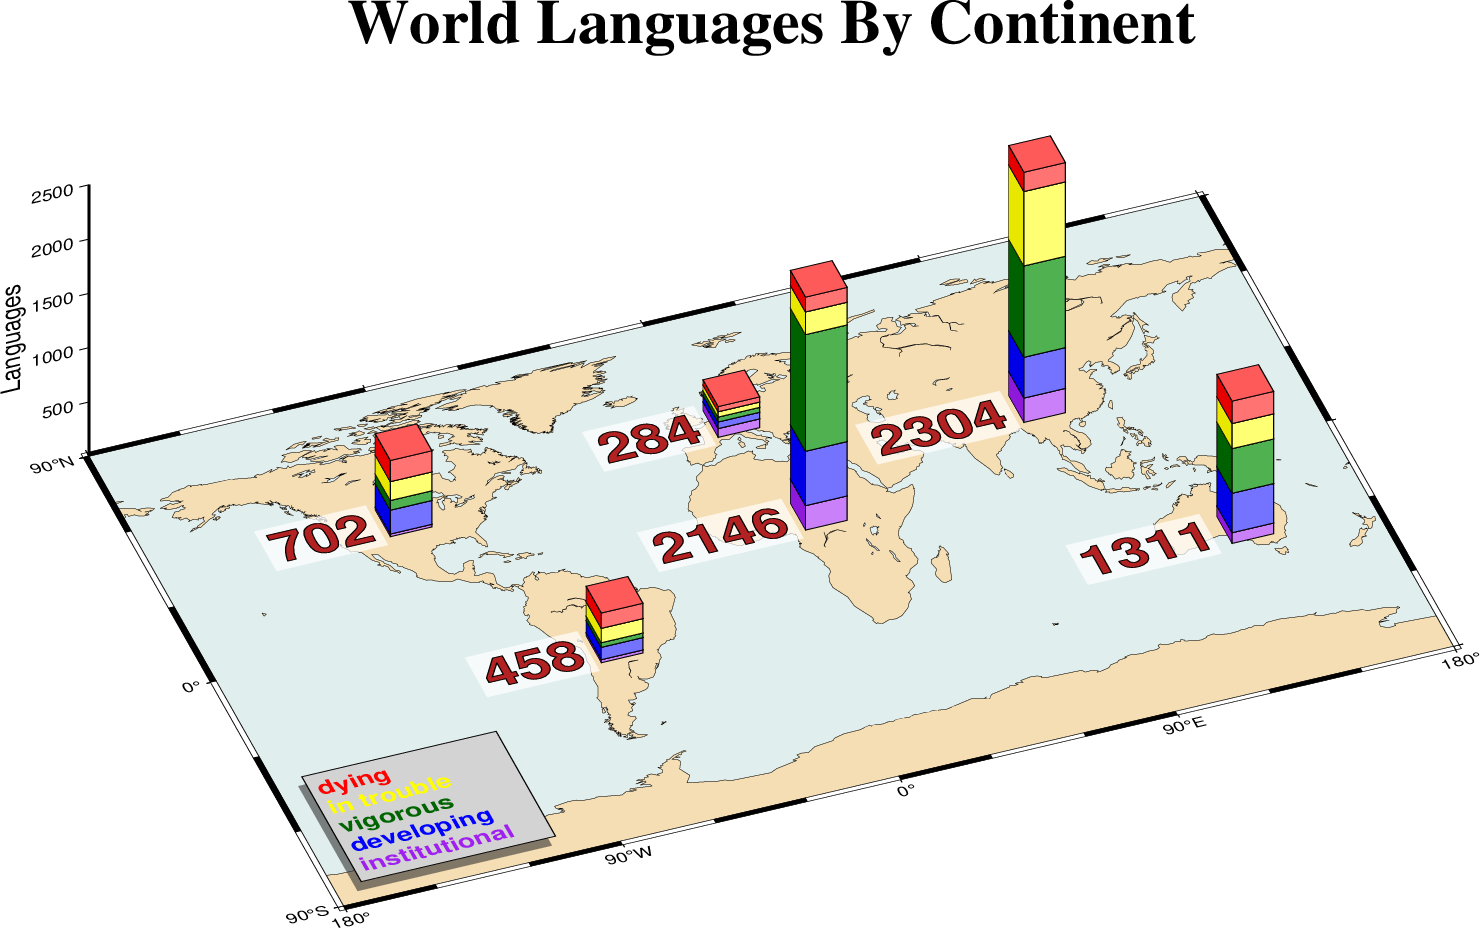
Geographical bar graph.