(47) Linear regression using different norms and types
In this example we show how the module gmtregress is used to fit a multitude of different linear regression models to a data set with extreme outliers that can also act as leverage points. This data set forms the basis for the main sequence in a Hertzsprung-Russell diagram of the star cluster CYG OB1, which includes four red giants that are outlying with respect to the main trend.
#!/usr/bin/env bash
#               GMT EXAMPLE 47
#
# Purpose:      Illustrate use of gmtregress with different norms and types
# GMT modules:  gmtregress, plot, text, subplot
# Unix progs:	rm
#

# Because all panels are almost identical we make a bash function that plots
# one panel.  It takes a few options that differ between panels.

function plot_one { # First 3-4 args are: -E -N -c [-Barg]
	gmt plot -B+ghoneydew${4} data.txt -Sc0.1c -Gblue $3
	gmt plot giants.txt -Sc0.1c -Gred   -N
	gmt plot giants.txt -Sc0.25c  -W0.25p -N
	gmt regress data.txt -Fxm $1 $2 -T2.85/5.25/0.1 | gmt plot -W2p
}

gmt begin ex47
	file=$(gmt which -G @hertzsprung-russell.txt)
	# Allow outliers (commented out by #) to be included in the analysis:
	sed -e s/#//g $file > data.txt
	# Identify the red giants (outliers)
	grep '#' $file | sed -e s/#//g > giants.txt
	gmt subplot begin 4x3 -M0p -Fs5c -R2.85/5.25/3.9/6.3 -JX-5c/5c -SRl+l"Log light intensity" -SCb+l"Log temperature"+tc -Bwesn -Bafg
	# L1 regressions
	plot_one -Ey -N1 -c0,0 +tL@-1@-
	plot_one -Ex -N1 -c1,0
	plot_one -Eo -N1 -c2,0
	plot_one -Er -N1 -c3,0
	#L2 regressions
	plot_one -Ey -N2 -c0,1 +tL@-2@-
	plot_one -Ex -N2 -c1,1
	plot_one -Eo -N2 -c2,1
	plot_one -Er -N2 -c3,1
	#LMS regressions - also add labels on right side
	plot_one -Ey -Nr -c0,2 +tLMS
	gmt text -F+cRM+jTC+a90+t"Y ON X" -N -Dj15p
	plot_one -Ex -Nr -c1,2
	gmt text -F+cRM+jTC+a90+t"X ON Y" -N -Dj15p
	plot_one -Eo -Nr -c2,2
	gmt text -F+cRM+jTC+a90+tORTHOGONAL -N -Dj15p
	plot_one -Er -Nr -c3,2
	gmt text -F+cRM+jTC+a90+t"REDUCED MAJOR AXIS" -N -Dj15p
	gmt subplot end
gmt end show
rm -f data.txt giants.txt hertzsprung-russell.txt
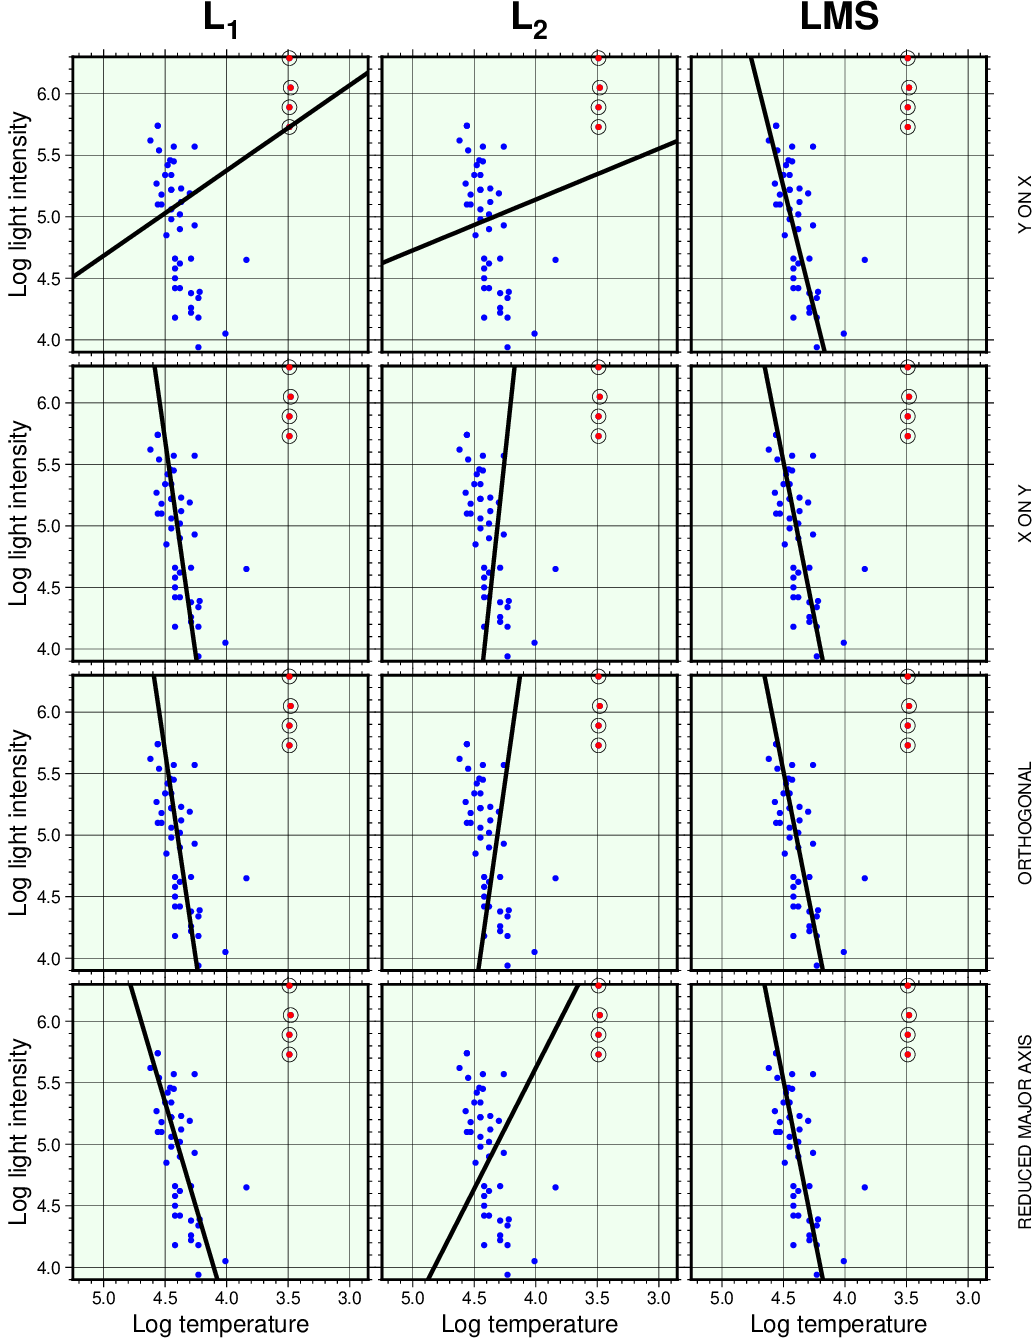
Robust and not-so-robust regressions.