(42) Antarctica and stereographic data
In this example we demonstrate how one can use combine Cartesian data for Antarctica (here the BEDMAP data already projected via a stereographic projection) with geographic data, all using the same map scale. It also shows how one would set up minor legends and map scales.
#!/usr/bin/env bash
#               GMT EXAMPLE 42
#
# Purpose:      Illustrate Antarctica and stereographic projection
# GMT modules:  makecpt, grdimage, coast, legend, colorbar, set, text, plot
# Unix progs:   [curl grdconvert]
#
gmt begin ex42
	gmt set PROJ_ELLIPSOID WGS-84
	# Data obtained via website and converted to netCDF thus:
	# curl http://www.antarctica.ac.uk//bas_research/data/access/bedmap/download/bedelev.asc.gz
	# gunzip bedelev.asc.gz
	# grdconvert bedelev.asc BEDMAP_elevation.nc=ns -V
	gmt makecpt -Cearth -T-7000/4000
	gmt grdimage @BEDMAP_elevation.nc -Jx1:60000000 -Q
	gmt coast -R-180/180/-90/-60 -Js0/-90/-71/1:60000000 -Bafg -Di -W0.25p
	gmt colorbar -DJRM+w6.5c/0.5c+o1c/0+mc -F+p+i -Bxa1000+lELEVATION -By+lm
	# GSHHG
	gmt coast -Glightblue -Sroyalblue2 -X5c -Y12c
	gmt coast -Glightbrown -A+ag -Bafg
	gmt legend -DjLM+w3.5c+jRM+o1c/0 -F+p+i <<- EOF
	H 12 Legend
	D 0.25c 1p
	S 0.4c s 0.3c blue       0.25p 0.75c Ocean
	S 0.4c s 0.3c lightblue  0.25p 0.75c Ice front
	S 0.4c s 0.3c lightbrown 0.25p 0.75c Grounding line
	EOF
	# Fancy line
	gmt plot -R0/19/0/25 -Jx1c -B0 -W2p -X-6c -Y-13.5c <<- EOF
	0	14
	6.5	14
	13	11.5
	19	11.5
	EOF
	gmt text -F+f18p+jBL -Dj8p/0 <<- EOF
	0 13 BEDMAP
	0 24 GSHHG
	EOF
gmt end show
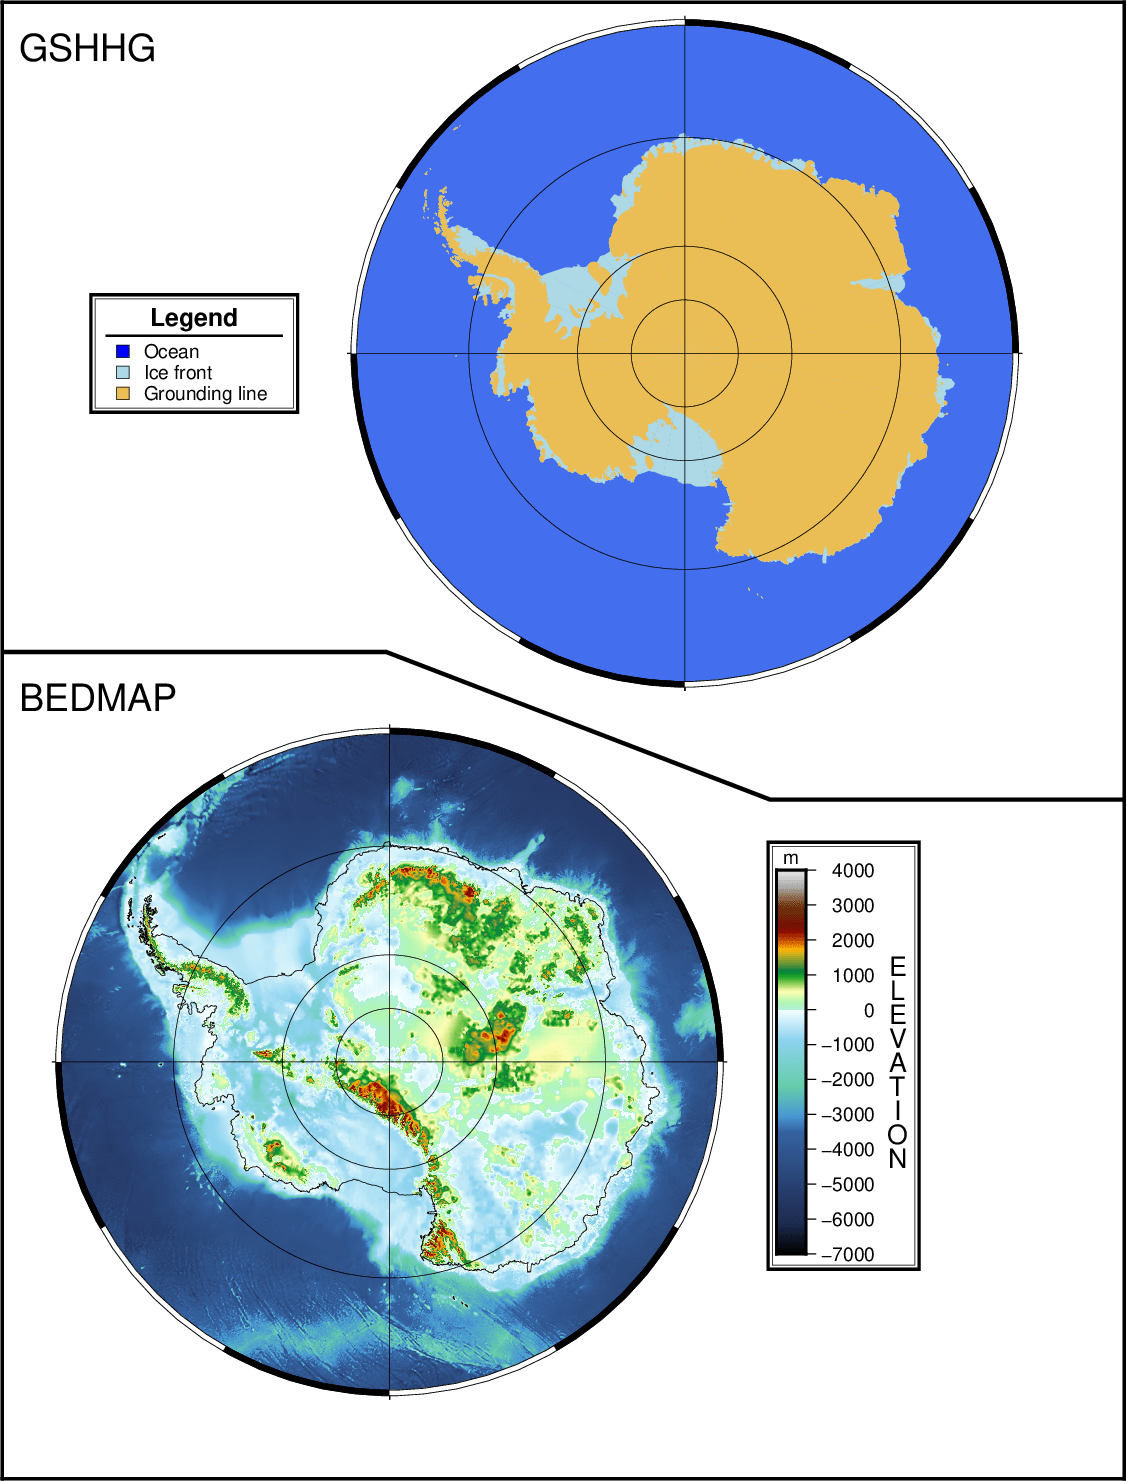
Illustrate plotting of Antarctica with Stereographic Data.