(21) Time-series of RedHat stock price
As discussed in the Cookbook Section Cartesian time axes, the annotation of time-series is generally more complicated due to the extra degrees of freedom afforded by the dual annotation system. In this example we will display the trend of the stock price of RedHat (RHAT) from their initial public offering until late 2006. The data file is a comma-separated table and the records look like this:
Date,Open,High,Low,Close,Volume,Adj.Close*
12-Mar-04,17.74,18.49,17.67,18.02,4827500,18.02
11-Mar-04,17.60,18.90,17.37,18.09,7700400,18.09
Hence, we have a single header record and various prices in USD for each day of business. We will plot the trend of the opening price as a red line superimposed on a yellow envelope representing the low-to-high fluctuation during each day. We also indicate when and at what cost Paul Wessel bought a few shares, and zoom in on the developments since 2004; in the inset we label the time-axis in Finnish in honor of Linus Thorvalds. Because the time coordinates are Y2K-challenged and the order is backwards (big units of years come after smaller units like days) we must change the default input/output formats used by GMT. Finally, we want to prefix prices with the $ symbol to indicate the currency. Here is how it all comes out:
#!/usr/bin/env bash
#		GMT EXAMPLE 21
#
# Purpose:	Plot a time-series
# GMT modules:	set, convert, info, basemap, plot
# Unix progs:	echo, rm
#
gmt begin ex21
	# File has time stored as dd-Mon-yy so set input format to match it
	gmt set FORMAT_DATE_IN dd-o-yy FORMAT_DATE_MAP o FONT_ANNOT_PRIMARY +10p
	gmt set FORMAT_TIME_PRIMARY_MAP abbreviated PS_CHAR_ENCODING ISOLatin1+

	# Pull out a suitable region string in yyy-mm-dd format
	wesn=($(gmt info -fT -I50 -C @RHAT_price.csv --FORMAT_DATE_IN=dd-o-yy))
	R="-R${wesn[0]}/${wesn[1]}/${wesn[2]}/${wesn[3]}"

	# Lay down the basemap:
	gmt basemap $R -JX22c/15c -Bsx1Y -Bpxa3Of1o -Bpy50+p"$ " \
		-BWSen+t"RedHat (RHT) Stock Price Trend since IPO"+glightgreen

	# Plot main window with open price as red line over yellow envelope of low/highs
	gmt set FORMAT_DATE_OUT dd-o-yy
	gmt convert -o0,2 -f0T @RHAT_price.csv > RHAT.env
	gmt convert -o0,3 -f0T -I -T @RHAT_price.csv >> RHAT.env
	gmt plot -Gyellow RHAT.env
	gmt plot @RHAT_price.csv -Wthin,red

	# Draw P Wessel's purchase price as line and label it.  Note we temporary switch
	# back to default yyyy-mm-dd format since that is what gmt info gave us.
	echo "05-May-00	0" > RHAT.pw
	echo "05-May-00	300" >> RHAT.pw
	gmt plot RHAT.pw -Wthinner,-
	echo "01-Jan-99	25" > RHAT.pw
	echo "01-Jan-02	25" >> RHAT.pw
	gmt plot RHAT.pw -Wthick,-
	gmt set FORMAT_DATE_IN yyyy-mm-dd
	echo "${wesn[0]} 25 PW buy" | gmt text -D4c/0.1c -N -F+f12p,Bookman-Demi+jLB
	gmt set FORMAT_DATE_IN dd-o-yy

	# Draw P Wessel's sales price as line and label it.
	echo "25-Jun-07	0" > RHAT.pw
	echo "25-Jun-07	300" >> RHAT.pw
	gmt plot RHAT.pw -Wthinner,-
	echo "01-Aug-06	23.8852" > RHAT.pw
	echo "01-Jan-08	23.8852" >> RHAT.pw
	gmt plot RHAT.pw -Wthick,-
	gmt set FORMAT_DATE_IN yyyy-mm-dd
	echo "${wesn[1]} 23.8852 PW sell" | gmt text -Dj1.6c/0.1c -N -F+f12p,Bookman-Demi+jRB
	gmt set FORMAT_DATE_IN dd-o-yy

	# Get smaller region for inset for trend since 2004
	R="-R2004T/${wesn[1]}/${wesn[2]}/40"

	# Lay down the basemap, using Finnish annotations and place the inset in the upper right
	gmt basemap --GMT_LANGUAGE=fi $R -JX15c/7c -Bpxa3Of3o -Bpy10+p"$ " -BESw+glightblue -Bsx1Y -X7c -Y8c

	# Again, plot close price as red line over yellow envelope of low/highs
	gmt plot -Gyellow RHAT.env
	gmt plot @RHAT_price.csv -Wthin,red

	# Draw P Wessel's sales price as dashed line
	gmt plot RHAT.pw -Wthick,-

	# Mark sales date
	echo "25-Jun-07	0" > RHAT.pw
	echo "25-Jun-07	300" >> RHAT.pw
	gmt plot RHAT.pw -Wthinner,-

	# Clean up after ourselves:
	rm -f RHAT.*
gmt end show
which produces the plot in Figure, suggesting Wessel has missed a few trains if he had hoped to cash in on the Internet bubble…
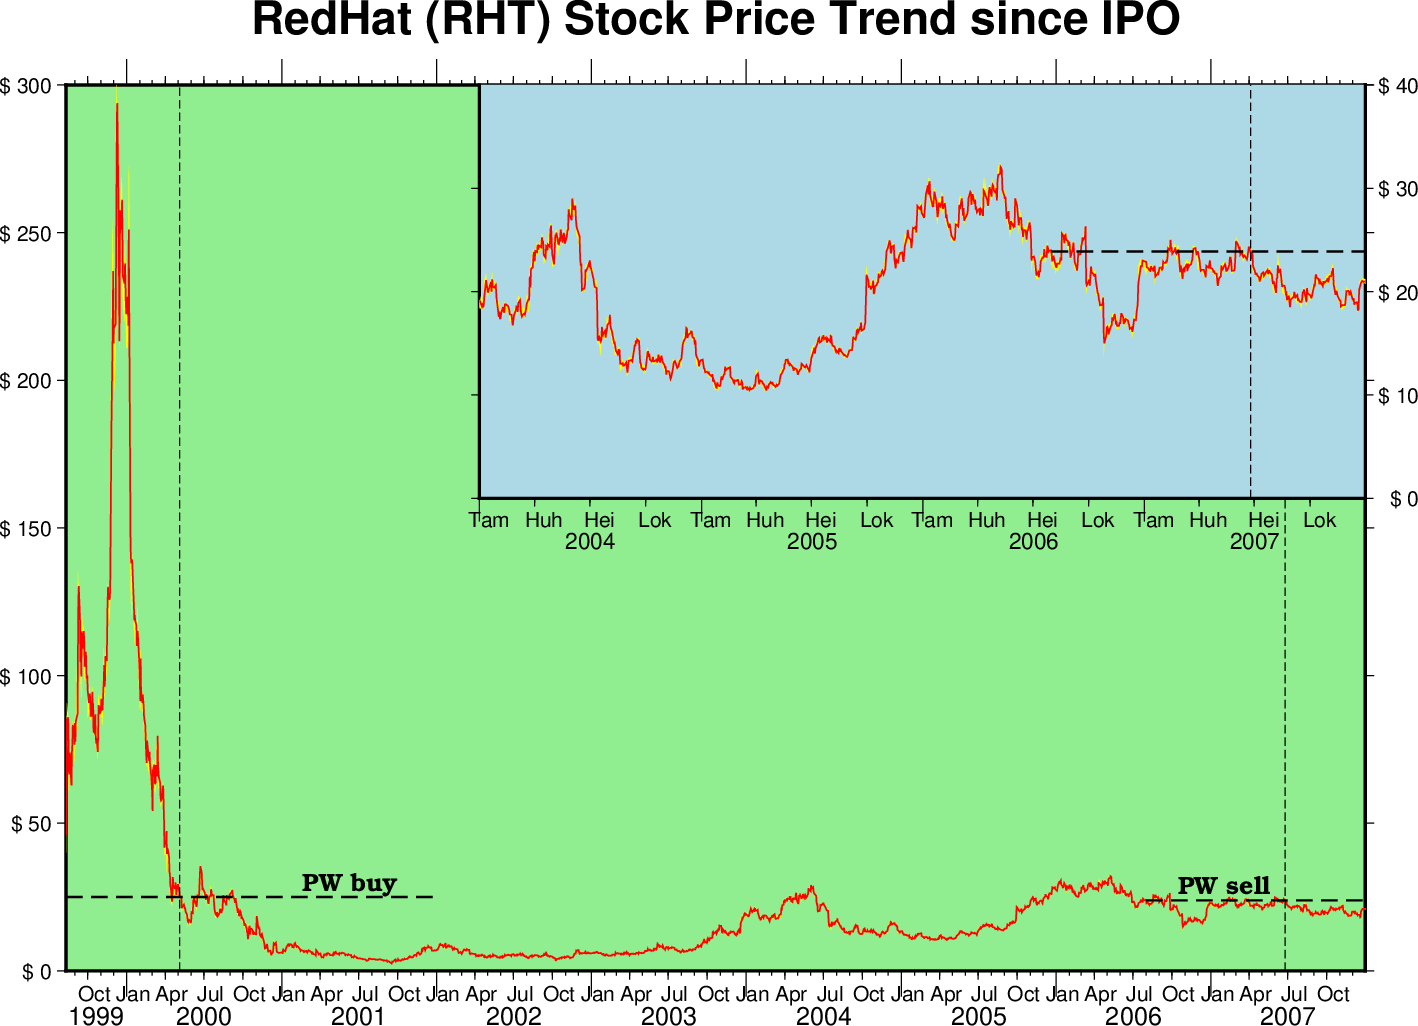
Time-series of RedHat stock price since IPO.