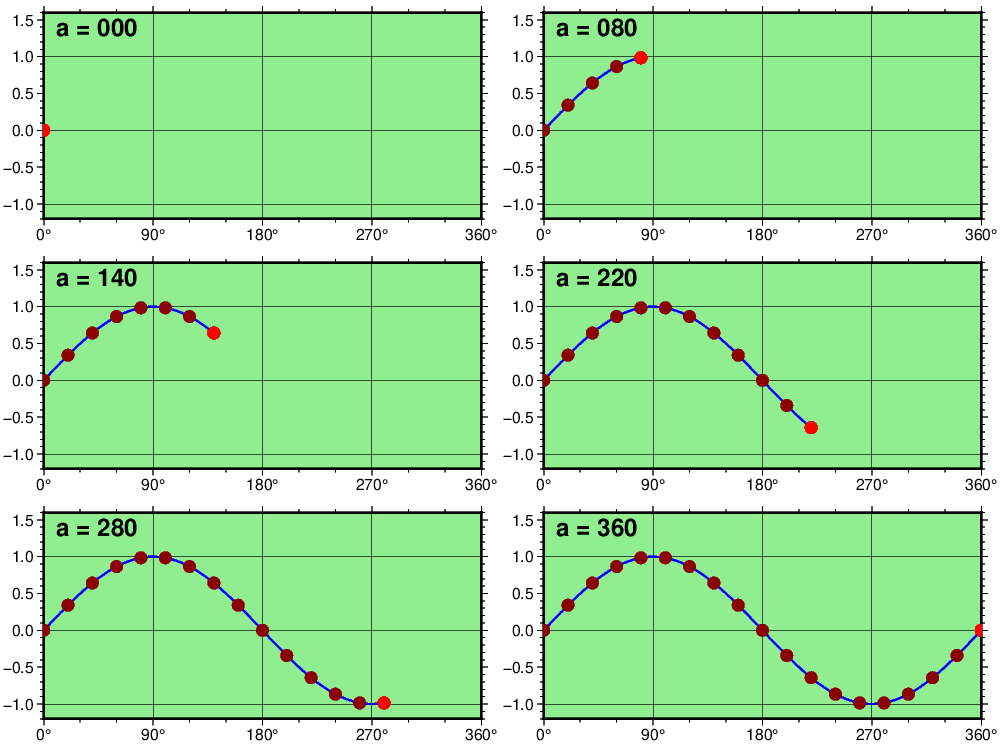
(1) Animation of the sine function
Our first animation is not very ambitious: We wish to plot the sine function from 0-360 and take snap shots every 20. To get a smooth curve we must sample the function much more frequently; we settle on 10 times more frequently than the frame spacing. We place a bright red circle at the leading edge of the curve, and as we move forward in time (here, angles) we dim the older circles to a dark red color. We add a label that indicates the current angle value. Once the 18 frames are completed we convert them to a single animated GIF file.
#!/usr/bin/env bash
#               GMT ANIMATION 01
#
# Purpose:      Make web page with simple animated GIF of sine function
# GMT modules:  math, basemap, text, plot, movie
# Unix progs:   echo, convert, cat
# Note:         Run with any argument to build movie; otherwise 1st frame is plotted only.

if [ $# -eq 0 ]; then	# Just make master PostScript frame 0
	opt="-Mps -Fnone"
else	# Make animated GIF
	opt="-A+l"
fi
# 1. Create files needed in the loop
cat << 'EOF' > pre.sh
gmt math -T0/360/20 T SIND = sin_point.txt
gmt math -T0/360/2 T SIND = sin_curve.txt
gmt begin
	gmt basemap -R0/360/-1.2/1.6 -JX3.5i/1.65i -X0.35i -Y0.25i \
	-BWSne+glightgreen -Bxa90g90f30+u@. -Bya0.5f0.1g1 --FONT_ANNOT_PRIMARY=9p
gmt end
EOF
# 2. Set up the main frame script
cat << 'EOF' > main.sh
gmt begin
#	Plot smooth blue curve and dark red dots at all angle steps so far
	last=$(gmt math -Q ${MOVIE_FRAME} 10 MUL =)
	gmt convert sin_curve.txt -Z0:${last} | gmt plot -W1p,blue -R0/360/-1.2/1.6 -JX3.5i/1.65i -X0.35i -Y0.25i
	gmt convert sin_point.txt -Z0:${MOVIE_FRAME} | gmt plot -Sc0.1i -Gdarkred
#	Plot bright red dot at current angle and annotate
	gmt plot -Sc0.1i -Gred <<< "${MOVIE_COL0} ${MOVIE_COL1}"
	printf "0 1.6 a = %3.3d" ${MOVIE_COL0} | gmt text -F+f14p,Helvetica-Bold+jTL -N -Dj0.1i/0.05i
gmt end
EOF
# 3. Run the movie
gmt movie main.sh -Sbpre.sh -C4ix2ix125 -Tsin_point.txt -Zs -Nanim01 -D5 $opt
Make sure you understand the purpose of all the steps in our script. In this case we did some trial-and-error to determine the exact values to use for the map projection, the region, the spacing around the frame, etc. so that the final result gave a reasonable layout. Do this planning on a single PostScript plot before running a lengthy animation script.

Animation of a simple sine function.