(34) Using country polygons for plotting and shading
The script produces the plot in Figure. Here we demonstrate how pscoast can be used to extract and plot country polygons. We show two panels; one in which we do a basic basemap and another where we lay down a color topography image and then place a transparent layer identifying the future Franco-Italian Union whose untimely breakup in 2045 the historians will continue to debate for some time.
#!/bin/bash
#               GMT EXAMPLE 34
#               $Id$
#
# Purpose:      Illustrate pscoast with DCW country polygons
# GMT modules:  gmtset, pscoast, makecpt, grdimage
# Unix progs:   rm
#
ps=example_34.ps
gmt set FORMAT_GEO_MAP dddF
gmt pscoast -JM4.5i -R-6/20/35/52 -EFR,IT+gP300/8 -Glightgray -Baf -BWSne -P -K -X2i > $ps
# Extract a subset of ETOPO2m for this part of Europe
# gmt grdcut etopo2m_grd.nc -R -GFR+IT.nc=ns
gmt makecpt -Cglobe -T-5000/5000 > z.cpt
gmt grdimage FR+IT.nc -I+a15+ne0.75 -Cz.cpt -J -O -K -Y4.5i \
	-Baf -BWsnE+t"Franco-Italian Union, 2042-45" >> $ps
gmt pscoast -J -R -EFR,IT+gred@60 -O >> $ps
# cleanup
rm -f gmt.conf z.cpt
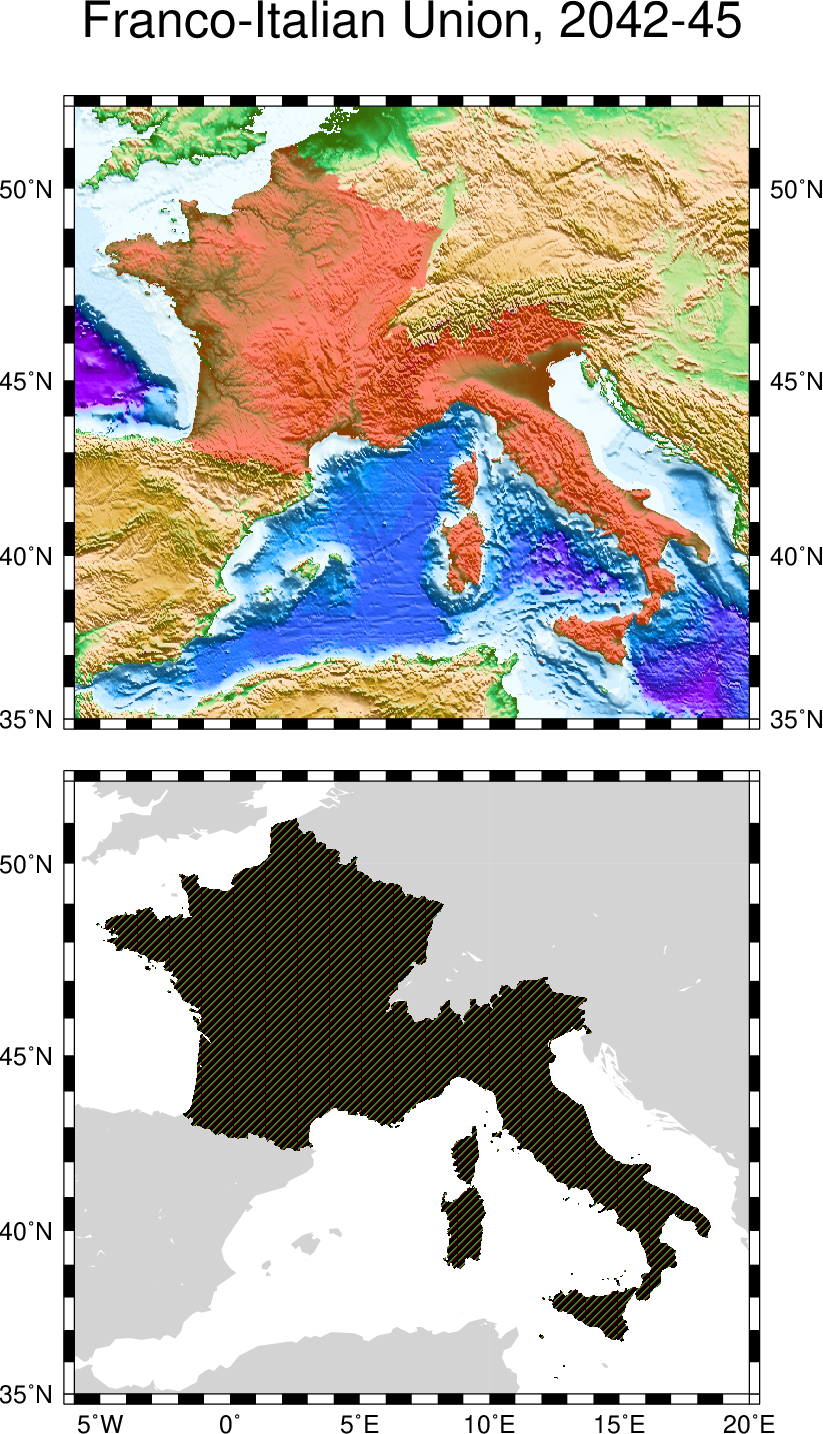
Using country polygons for plotting and shading.