(7) A simple location map
Many scientific papers start out by showing a location map of the region
of interest. This map will typically also contain certain features and
labels. This example will present a location map for the equatorial
Atlantic ocean, where fracture zones and mid-ocean ridge segments have
been plotted. We also would like to plot earthquake locations and
available isochrons. We have obtained one file, quakes.xym, which contains the
position and magnitude of available earthquakes in the region. We choose
to use magnitude/100 for the symbol-size in inches. The digital fracture
zone traces (fz.xy) and isochrons (0 isochron as ridge.xy, the rest as isochrons.xy) were
digitized from available maps [1]. We create the final location map
with the following script:
#!/bin/bash
#		GMT EXAMPLE 07
#		$Id$
#
# Purpose:	Make a basemap with earthquakes and isochrons etc
# GMT modules:	pscoast, pslegend, pstext, psxy
# Unix progs:
#
ps=example_07.ps
gmt pscoast -R-50/0/-10/20 -JM9i -K -Slightblue -GP300/26:FtanBdarkbrown -Dl -Wthinnest \
	-B10 --FORMAT_GEO_MAP=dddF > $ps
gmt psxy -R -J -O -K fz.xy -Wthinner,- >> $ps
gmt psxy quakes.xym -R -J -O -K -h1 -Sci -i0,1,2+s0.01 -Gred -Wthinnest >> $ps
gmt psxy -R -J -O -K isochron.xy -Wthin,blue >> $ps
gmt psxy -R -J -O -K ridge.xy -Wthicker,orange >> $ps
gmt pslegend -R -J -O -K -DjTR+w2.2i+o0.2i -F+pthick+ithinner+gwhite --FONT_ANNOT_PRIMARY=18p,Times-Italic<< EOF >> $ps
S 0.1i c 0.08i red thinnest 0.3i ISC Earthquakes
EOF
gmt pstext -R -J -O -F+f30,Helvetica-Bold,white=thin >> $ps << END
-43 -5 SOUTH
-43 -8 AMERICA
 -7 11 AFRICA
END
Here a simple one-liner creates a simple legend in the upper-right corner.
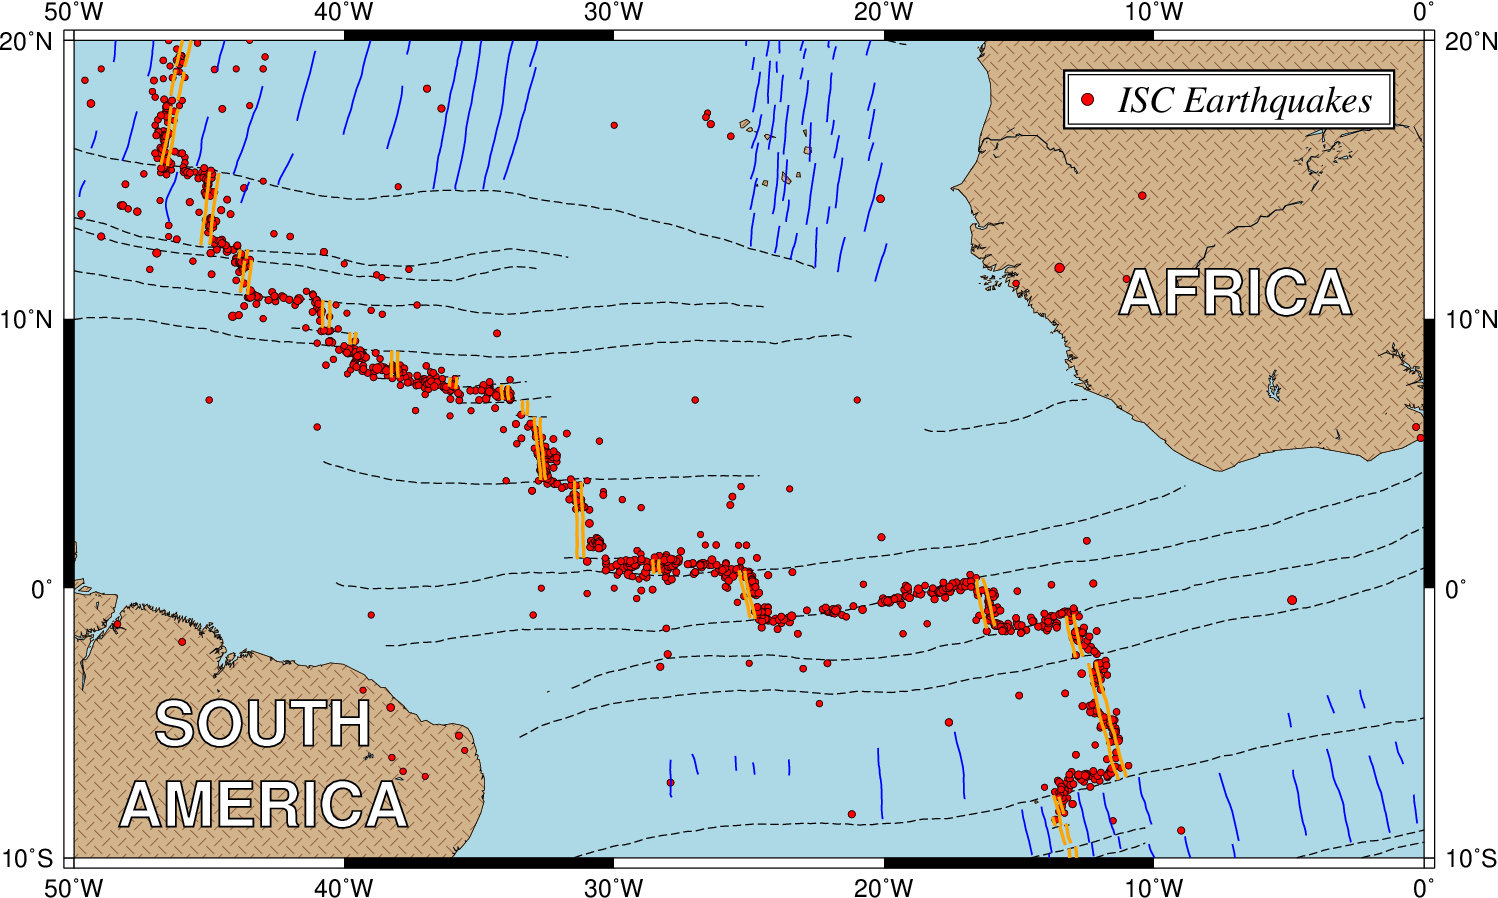
A typical location map.
| [1] | These data are available on CD-ROM from NGDC (www.ngdc.noaa.gov). |