(6) Plotting of histograms
GMT provides two tools to render histograms:
pshistogram and psrose. The former takes care of
regular histograms whereas the latter deals with polar histograms (rose
diagrams, sector diagrams, and wind rose diagrams). We will show an
example that involves both programs. The file fractures.yx contains a compilation of
fracture lengths and directions as digitized from geological maps. The
file v3206.t contains all the bathymetry measurements from Vema cruise 3206.
Our complete figure was made running
this script:
#!/bin/bash
#		GMT EXAMPLE 06
#		$Id$
#
# Purpose:	Make standard and polar histograms
# GMT modules:	pshistogram, psrose
# Unix progs:	rm
#
ps=example_06.ps
gmt psrose fractures.txt -: -A10r -S1.8in -P -Gorange -R0/1/0/360 -X2.5i -K -Bx0.2g0.2 \
	-By30g30 -B+glightblue -W1p > $ps
gmt pshistogram -Bxa2000f1000+l"Topography (m)" -Bya10f5+l"Frequency"+u" %" \
	-BWSne+t"Histograms"+glightblue v3206.t -R-6000/0/0/30 -JX4.8i/2.4i -Gorange -O \
	-Y5.0i -X-0.5i -L1p -Z1 -W250 >> $ps
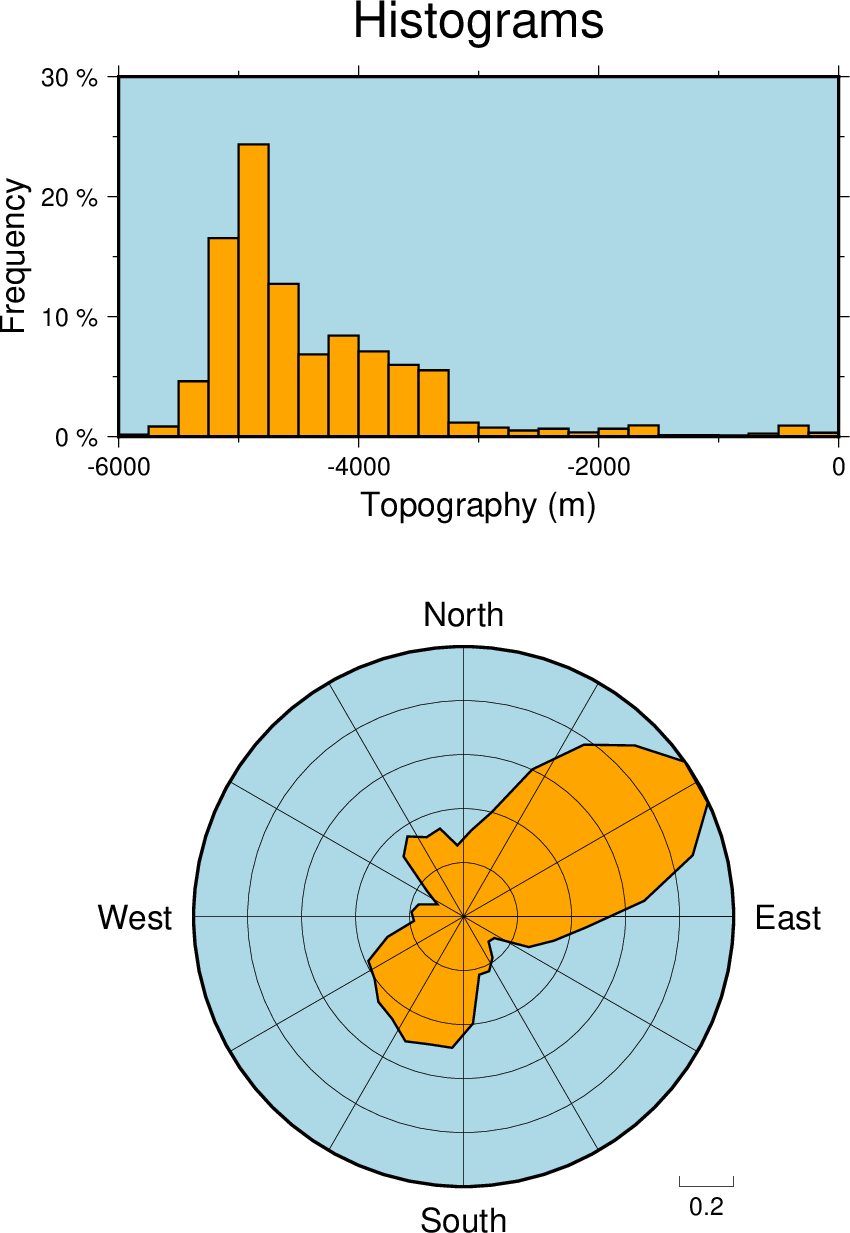
Two kinds of histograms.