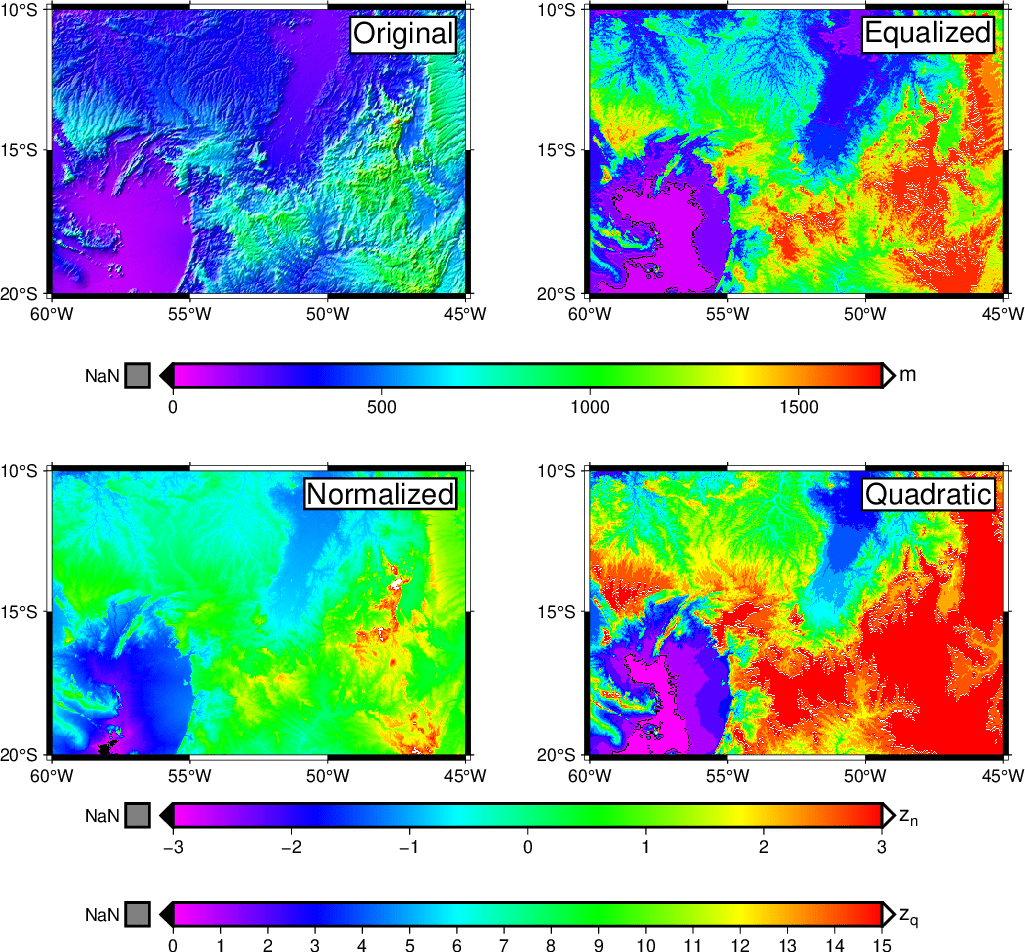
(38) Histogram equalization of bathymetry grids
This example shows how to use histogram equalization to enhance various ranges of a grid depending on its frequency distribution. The key tool used here is grdhisteq.
#!/usr/bin/env bash
#               GMT EXAMPLE 38
#
# Purpose:      Illustrate histogram equalization on topography grids
# GMT modules:  colorbar, text, makecpt, grdhisteq, grdimage
# Unix progs:   rm
#
gmt begin ex38
	gmt set FONT_TAG 14p

	gmt makecpt -Crainbow -T0/1700 -H > t.cpt
	gmt makecpt -Crainbow -T0/15/1 -H > c.cpt
	gmt makecpt -Crainbow -T-3/3 -H > n.cpt
	gmt makecpt -Crainbow -T0/15 -H > q.cpt
	gmt grdcut @earth_relief_02m -R-60/-45/-20/-10 -Gtopo_38.nc

	gmt subplot begin 2x2 -Fs7c -A+jTR+gwhite+p1p+o0.2c/0.2c -M0.75c/1.2c -Rtopo_38.nc -JM7c -B5 -BWSen -Y10c
		gmt subplot set 0 -A"Original"
		gmt grdimage topo_38.nc -I+d -Ct.cpt

		gmt subplot set 1 -A"Equalized"
		gmt grdhisteq topo_38.nc -Gout.nc -C16
		gmt grdimage out.nc -Cc.cpt

		gmt subplot set 2 -A"Normalized"
		gmt grdhisteq topo_38.nc -Gout.nc -N
		gmt grdimage out.nc -Cn.cpt

		gmt subplot set 3 -A"Quadratic"
		gmt grdhisteq topo_38.nc -Gout.nc -Q
		gmt grdimage out.nc -Cq.cpt
	gmt subplot end

	gmt colorbar -DJTC+w12c/0.4c+jTC+o0c/6c+h+e+n -Ct.cpt -Bxa500 -By+lm
	gmt colorbar -DJBC+w12c/0.4c+h+e+n -Cn.cpt -Bx1 -By+l"z@-n@-"
	gmt colorbar -DJBC+w12c/0.4c+h+e+n+o0c/2.5c -Cq.cpt -Bx1 -By+l"z@-q@-"
	rm -f out.nc topo_38.nc ?.cpt
gmt end show

Histogram equalization of bathymetry grids.