(34) Using country polygons for plotting and shading
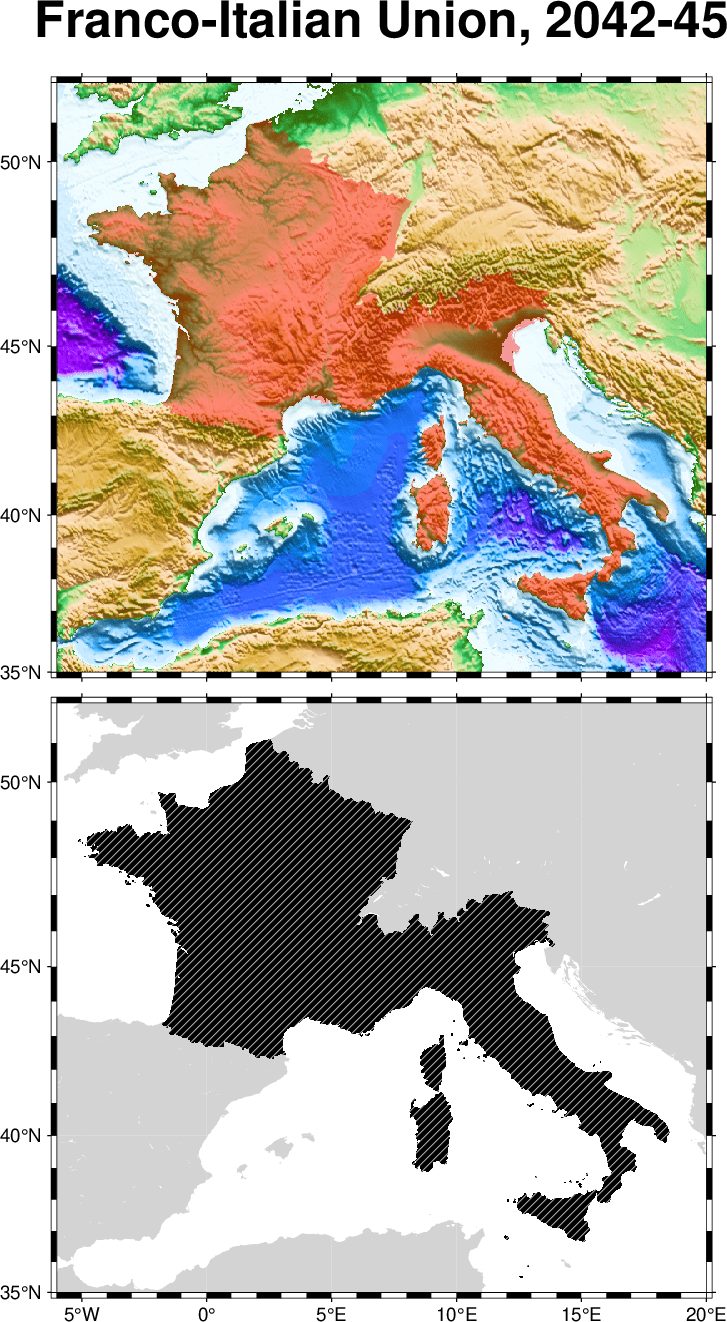
The script produces the plot in Figure. Here we demonstrate how coast can be used to extract and plot country polygons from the optional DCW dataset. We show two panels; one in which we do a basic basemap and another where we lay down a color topography image and then place a transparent layer identifying the future Franco-Italian Union, whose untimely breakup in 2045 the historians will continue to debate for some time.
#!/usr/bin/env bash
#               GMT EXAMPLE 34
#
# Purpose:      Illustrate coast with DCW country polygons
# GMT modules:  set, coast, makecpt, grdimage, subplot
#
gmt begin ex34
	gmt set FONT_HEADING 24p
	gmt makecpt -Cglobe -T-5000/5000
	gmt subplot begin 2x1 -Fs11c/0 -M0.1c -JM11c -R-6/20/35/52 -Srl -Scb -Bwesn -T"Franco-Italian Union, 2042-45"
		gmt coast -EFR,IT+gP300/8 -Glightgray -c1,0
		# Plot a subset of earth_relief_02m for this part of Europe
		gmt grdimage @earth_relief_02m -I+a15+ne0.75 -c0,0
		gmt coast -EFR,IT+gred@60
	gmt subplot end
gmt end show
Using country polygons for plotting and shading.