(7) A simple location map
Many scientific papers start out by showing a location map of the region
of interest. This map will typically also contain certain features and
labels. This example will present a location map for the equatorial
Atlantic ocean, where fracture zones and mid-ocean ridge segments have
been plotted. We also would like to plot earthquake locations and
available isochrons. We have obtained one file, quakes_07.txt, which contains the
position and magnitude of available earthquakes in the region. We choose
to use magnitude/40 for the symbol-size in cm. The digital fracture
zone traces (fz_07.txt) and isochrons (0 isochron as ridge_07.txt,
the rest as isochron_07.txt) were
digitized from available maps 1. We create the final location map
with the following script:
#!/usr/bin/env bash
#		GMT EXAMPLE 07
#
# Purpose:	Make a basemap with earthquakes and isochrons etc
# GMT modules:	coast, legend, text, plot
#
gmt begin ex07
	gmt coast -R-50/0/-10/20 -JM24c -Slightblue -GP26+r300+ftan+bdarkbrown -Dl -Wthinnest -B --FORMAT_GEO_MAP=dddF
	gmt plot @fz_07.txt -Wthinner,-
	gmt plot @quakes_07.txt -h1 -Scc -i0,1,2+s0.025 -Gred -Wthinnest -l"ISC Earthquakes"+S0.2c
	gmt plot @isochron_07.txt -Wthin,blue
	gmt plot @ridge_07.txt -Wthicker,orange
	gmt legend -DjTR+o0.5c -F+pthick+ithinner+gwhite --FONT_ANNOT_PRIMARY=18p,Times-Italic
	gmt text -F+f30,Helvetica-Bold,white=thin <<- END
	-43 -5 SOUTH
	-43 -8 AMERICA
	 -7 11 AFRICA
	END
gmt end show
Here a simple one-liner creates a simple legend in the upper-right corner.
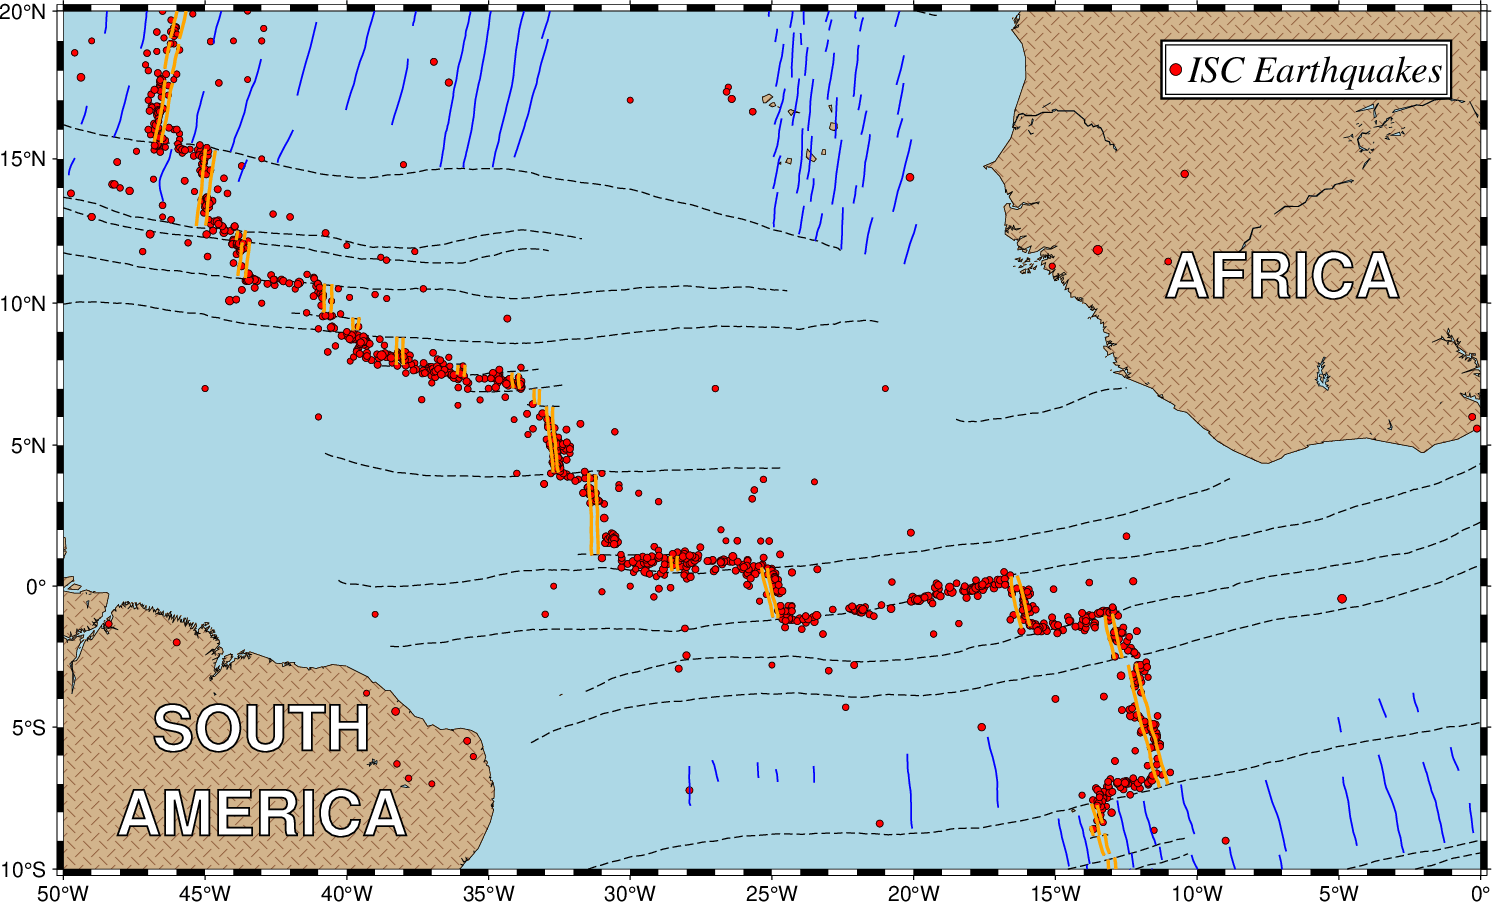
A typical location map.
Footnote
- 1
These data are available on CD-ROM from NCEI (www.ncei.noaa.gov).