events
Plot event symbols, lines, polygons and labels for one moment in time
Synopsis
gmt events -Jparameters -Rwest/east/south/north[/zmin/zmax][+r][+uunit] -Tnow [ table ] [ -Ar[dpu[c|i][+z[z]]]|s ] [ -B[p|s]parameters ] [ -Ccpt ] [ -D[j|J]dx[/dy][+v[pen]] ] [ -E[s|t][+o|Odt][+rdt][+pdt][+ddt][+fdt][+ldt] ] [ -F[+aangle][+ffont][+jjustify][+r[first]|z[format]] ] [ -Gcolor ] [ -Hlabelbox ] [ -L[length|t] ] [ -Mi|s|t|zval1[+cval2] ] [ -N[c|r] ] [ -Qprefix ] [ -Ssymbol[size] ] [ -U[stamp] ] [ -V[level] ] [ -Wpen ] [ -X[a|c|f|r][xshift] ] [ -Y[a|c|f|r][yshift] ] [ -Zcommand ] [ -aflags ] [ -bibinary ] [ -di[+ccol]nodata ] [ -eregexp ] [ -fflags ] [ -hheaders ] [ -iflags ] [ -pflags ] [ -qiflags ] [ -wflags ] [ -:[i|o] ] [ --PAR=value ]
Description
Reads (x, y[, z] [, size], time [, length] [, label]) data from table [or standard input] and plots how the symbol for each event should look for the specified time now. The reason they may differ is that events may have different durations and we may wish to accentuate the symbol attributes in ways to draw attention to an event when it first appears and perhaps tone it down after a while to reduce clutter and focus on more recent events. Optionally, each symbol may have a label that can be displayed at the same time or delayed with respect to the symbol. This module is typically used in conjunction with movie where the implicit loop over time is used to call events over a time-sequence and thus plot symbols as the events unfold.
Required Arguments
- table
One or more ASCII (or binary, see -bi[ncols][type]) data table file(s) holding a number of data columns. If no tables are given then we read from standard input.
- -Jparameters
Specify the projection. (See full description) (See cookbook summary) (See projections table).
- -Rxmin/xmax/ymin/ymax[+r][+uunit]
Specify the region of interest. (See full description) (See cookbook information).
For perspective view -p, optionally append /zmin/zmax. (more …)
- -Tnow
Set the current plot time. The time shifts and increments set in -E are all relative to this current time. If an absolute time is given you may need to use TIME_UNIT to indicate the unit of the values given in options like -E and -L.
Optional Arguments
- -Ar[dpu[c|i][+z[z]]]|s
When no -S is given we expect to read lines or polygons. Two different forms for input are supported and specified via the chosen -A directives: (1) Choose -Ar if your input data are trajectories, the data format is given as x, y, time, and the “event” is the portion of that trajectories limited by the current time (now), event duration (via -L) and rise/fade periods (via -Es). If current time falls between two points on the trajectory then we linearly interpolate to find the current end point. Alternatively, (2) choose -As to read each complete segment (i.e., a polygon or line with just x, y coordinates) from a multisegment file and get a common time for each segment via a required -Tstring specified in the segment header. Here, the entire polygon or line is the “event” if inside the limits of current time (now), event duration (via -L) and rise/fade periods (via -Es). If -L[t] is set then the string must be either of the format begin/length|end or begin,length|end. Use a comma to separate absolute time specifications, otherwise a slash is also supported. Note: Neither lines nor polygons allow for any labels to be placed. Finally, you can use -Ardpu to perform no plotting but instead convert your x, y[, zcols ], time data into densely sampled points so that later calls to events may use this sampled data set instead and plot it as circles with -Sc[width]. This way you can plot “lines” that can have variable pen color and fixed or variable pen width as well as taking advantage of the full machinery of -Es and -Et and all the effects controlled by -M for symbols. The dpu must match the intended dpu when running movie. Note dpu means pixels per cm if you are using SI units and pixels per inch if you are using US units (hence it depends on your PROJ_LENGTH_UNIT setting). Alternatively, append c or i to set the unit used explicitly. Also note that if your movie involves changes to the region or the map projection then you may need to run the -Ardpu as part of the main script. Finally, use +z[z] to insert a z-column (initialized to zero unless another z value is appended) in the dense point data file for use with -Mz.
- -B[p|s]parameters
Set map boundary frame and axes attributes. (See full description) (See cookbook information).
- -Ccpt
Use the cpt to convert z values given in the optional third column to assign symbol or polygon colors. Not allowed if -Ar is used.
- -D[j|J]dx[/dy][+v[pen]]
Offset the text from the projected (x,y) point by dx,dy [0/0]. If dy is not specified then it is set equal to dx. Use -Dj to offset the text away from the point instead (i.e., the text justification will determine the direction of the shift). Using -DJ will shorten diagonal offsets at corners by sqrt(2). Optionally, append +v which will draw a line from the original point to the shifted point; append a pen to change the attributes for this line.
- -E[s|t][+o|Odt][+rdt][+pdt][+ddt][+fdt][+ldt]
Set the time knots for the symbol or text time-functions. Append +o to shift the event start and end times by a constant offset (basically shifting the event in time by dt; or use +O to only shift the start time, effectively shortening the duration of the event), +r to indicate the duration of the rise phase, +p to set the duration of the plateau phase, +d to specify the duration of the decay phase, and +f to set the duration of the fade phase. These are all optional [and default to zero], and can be set separately for symbols and texts. If neither s or t is given then we set the time knots for both features. Note 1: The +l modifier is restricted to -Et and specifies an alternative duration (visibility) of the text [same duration as symbol]. Furthermore, the +p and +d periods do not apply to text labels. Note 2: The -Et option is required if you wish to plot labels [plot symbols only]. Note 3: For lines or polygons the +p and +d periods do not apply, and for lines none of the modifiers are allowed.
- -F[+aangle][+ffont][+jjustify][+r[first]|z[format]]
By default, event label text will be placed horizontally, using the primary annotation font attributes (FONT_ANNOT_PRIMARY), and centered on the data point. Use this option to override these defaults by specifying up to three text attributes (font, angle, and justification) directly on the command line. Use +f to set the font (size,fontname,color), +a to set the angle, and +j to set the justification. Normally, the text to be plotted is the trailing text. Instead, use +r to use the record number (counting up from first [0]) or +z to format incoming z values (requires -C) to a string using the supplied format [use FORMAT_FLOAT_MAP].
- -Gfill (more …)
Set constant shade or color for all symbols or polygons.
- -H[+cdx/dy][+gfill][+p[pen]][+r][+s[[dx/dy/][shade]]]
Enable bounding boxes around text labels and provide one or more of these specific parameters: Add +c to adjust the clearance between the text and the surrounding box [15% of font size]. Add +p to draw the box outline with MAP_DEFAULT_PEN or append a different pen. Add +gfill to fill the text box [no fill]. Append +r to use a rounded rectangular box instead of straight rectangular box. Append +s to place an offset, background shaded box behind the text box. Here, dx/dy indicates the shift relative to the foreground text box [4p/-4p] and shade changes the fill used for shading [gray50]. Note: Modifier +s requires +g as well.
- -Jz|Zparameters
Set z-axis scaling; same syntax as -Jx.
- -L[length|t]
Specify the length (i.e., duration) of the event. Append a length if all events have the same length, append t if end-times instead of lengths are given in the file after the time column, or leave blank if lengths can be read from the input file after the time column. If -L is not given we assume events have an infinite duration. See -A for how duration is handled for lines and polygons.
-Mi|s|t|zval1[+cval2] ]
Modify the initial intensity of the color, the size of the symbol, its transparency or the z data value during the rise interval [Defaults are 1, 1, 100, and 0 respectively]. Option -M is repeatable for the different attributes. Optionally, for finite-duration events you may append +c to set the corresponding terminal value during the coda [0, 0, 100, 0, respectively]. The intensity setting (normally in the interval ±1, with 0 having no effect) is used to brighten (intensity > 0) or darken (intensity < 0) the symbol color during this period (hue is kept fixed). The size setting is a magnifying factor that temporarily changes the size of the symbol. The transparency setting affects temporary changes to the symbol’s transparency. Finally, the z-data setting temporarily adds val1 to the data set’s z-values per the time function, and thus can change the symbol’s color via the CPT (hence -C is a required option for -Mz). Note: Polygons can only use -Mt setting.
- -N[c|r]
Do NOT clip symbols that fall outside map border [Default plots points whose coordinates are strictly inside the map border only]. For periodic (360-longitude) maps we must plot all symbols twice in case they are clipped by the repeating boundary. The -N will turn off clipping and not plot repeating symbols. Use -Nr to turn off clipping but retain the plotting of such repeating symbols, or use -Nc to retain clipping but turn off plotting of repeating symbols. If set, -N will also apply to any labels.
- -Qprefix
Save the intermediate event symbols and labels to permanent files instead of removing them when done. Files will be named prefix_symbols.txt and prefix_labels.txt.
- -Ssymbol[size]
Specify the symbol to use for the event [Default plots lines or polygons; see -A]. Optionally, append symbol size with unit from (c|i|p). If no size is given then we read an event-specific size from the data file’s third column (fourth if -C is used). Note: Not all the symbols that are available in plot can be used here. At the moment we only support the basic symbols and custom symbols; bars, vectors, ellipses, fronts, decorated and quoted lines cannot be specified. Symbols sizes read from a data file will be assumed to be in the unit controlled by PROJ_LENGTH_UNIT unless they have c, i, or p appended. If you are only plotting labels then -S is not required.
- -U[label|+c][+jjust][+odx[/dy]]
Draw GMT time stamp logo on plot. (See full description) (See cookbook information).
- -V[level]
Select verbosity level [w]. (See full description) (See cookbook information).
- -Wpen
Specify symbol outline pen attributes [Default is no outline].
- -X[a|c|f|r][xshift]
Shift plot origin. (See full description) (See cookbook information).
- -Y[a|c|f|r][yshift]
Shift plot origin. (See full description) (See cookbook information).
- -Zcommand
Place symbols generated by either coupe, meca, or velo. The quoted command must start with one of these module names, then supply all the module-specific options that the selected module requires to normally define a plot, excluding any of -C, -G, -J, -N, -R, and -W (those options may be required by events though). Also, you may not use the -I or -t options since these will be set automatically as part of the variations imposed by -Mi and -Mt. As an example, the custom command to plot a beachball may be -Z“meca -Sa5c+f0”, while displaying a crossection of one may require the more elaborate command -Z“coupe -Q -L -Sc3c -Ab128/11/120/250/90/400/0/100+f -Fa0.1i/cc”. Note: If you are running a simple classic command then you must use classic module names.
- -a[[col=]name[,…]] (more …)
Set aspatial column associations col=name.
- -birecord[+b|l] (more …)
Select native binary format for primary table input. [Default is 3 input columns].
- -dinodata[+ccol] (more …)
Replace input columns that equal nodata with NaN.
- -e[~]“pattern” | -e[~]/regexp/[i] (more …)
Only accept data records that match the given pattern.
- -f[i|o]colinfo (more …)
Specify data types of input and/or output columns.
- -h[i|o][n][+c][+d][+msegheader][+rremark][+ttitle] (more …)
Skip or produce header record(s).
- -icols[+l][+ddivisor][+sscale|d|k][+ooffset][,…][,t[word]] (more …)
Select input columns and transformations (0 is first column, t is trailing text, append word to read one word only).
- -p[x|y|z]azim[/elev[/zlevel]][+wlon0/lat0[/z0]][+vx0/y0] (more …)
Select perspective view.
- -qi[~]rows|limits[+ccol][+a|f|s] (more …)
Select input rows or data limit(s) [default is all rows].
- -:[i|o] (more …)
Swap 1st and 2nd column on input and/or output.
- -^ or just -
Print a short message about the syntax of the command, then exit (NOTE: on Windows just use -).
- -+ or just +
Print an extensive usage (help) message, including the explanation of any module-specific option (but not the GMT common options), then exit.
- -? or no arguments
Print a complete usage (help) message, including the explanation of all options, then exit.
- --PAR=value
Temporarily override a GMT default setting; repeatable. See gmt.conf for parameters.
The meaning of time
While normally the meaning of “time” (e.g., such as in the argument to -T) is in fact the time of the phenomenon being plotted, it may also be any other monotonically increasing quantity of convenience, such as elapsed time, model time, frame number, or other physical quantities such as distance. It all depends on the context of the movie. The values given for delays, fades, etc. in -E are assumed to be in the same unit as the given time argument to -T. Thus, if time is a monotonically increasing frame counter then the values in -E and -L refer to number of frames. A special situation occurs when time is in fact actual calendar time given by date/clock markers. Here, the unit of the arguments in -E and -L is determined by the TIME_UNIT setting [second]. You will need to specify the desired time unit that should be used when interpreting your -E and -L arguments. The example below for seismicity uses actual earthquake times but we use days as the unit as second is too small.
The four time-functions
Events typically have either a finite length, e.g., the temporal extent of the reign of a particular monarch, or are infinite. Here, infinite simply means its length exceeds the temporal extent of the time we are plotting. In a movie, a basic representation of these events as points on a map would be to start plotting the symbol when the event starts and then keep the symbol visible on all frames until the event ends (or never stop plotting them in the infinite length case). However, to draw attention to the arrival of a new event we can temporarily change four attributes of the symbol: Its size, color intensity, transparency, and color (via CPT look-up). You can think of these four attributes as functions of time. For some option settings, the figure below illustrates how the symbol size may vary through the timespan of the movie.
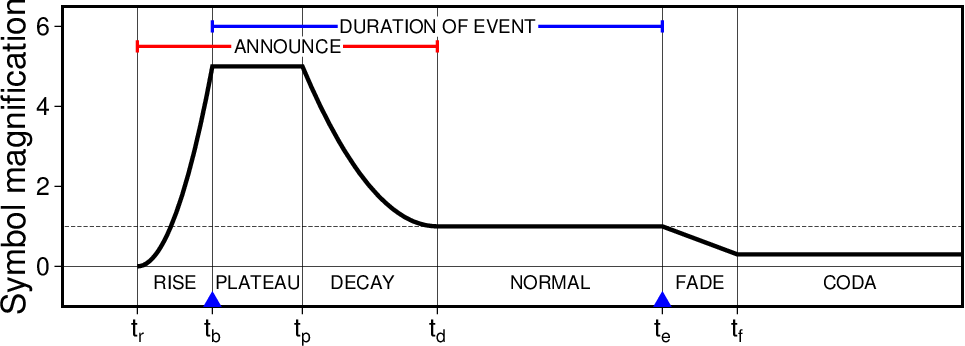
Implied evolution of one symbol’s size-variation as a function of time given the time-knots from -Es and the magnifications from -Ms. Here we temporarily magnify the symbol size five times before decaying to the intended size and eventually shrink it further down to a small size during the fade and coda phases.
Similarly, to draw attention to the newly arrived event you may want to whiten the color temporarily; this can be done via the -Mi option and figure below illustrates how intensity may vary accordingly.
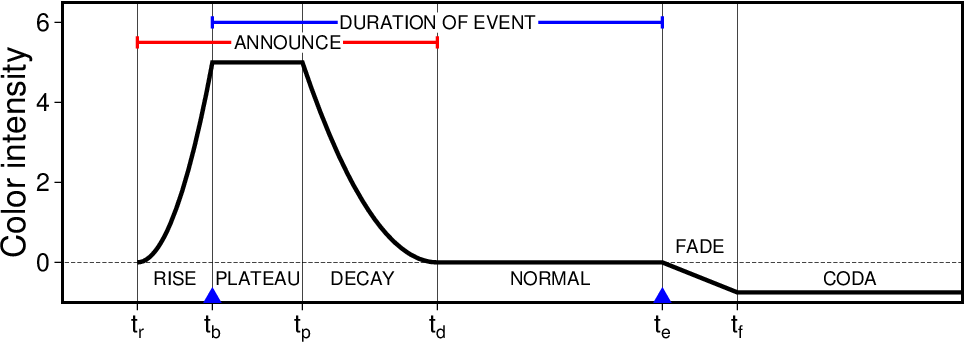
Implied evolution of one symbol’s color intensity as a function of time given the time-knots from -Es and the intensities from -Mi. Here we seek to whiten the symbol during the event arrival, as well as darken it during a permanent code phase.
Next, for finite events you may wish to either fade them out completely or simply fade them to a constant but still visible transparency; this future stage is referred to as the coda and levels can be specified via the -Mt option. Figure below illustrates how transparency may vary through time.
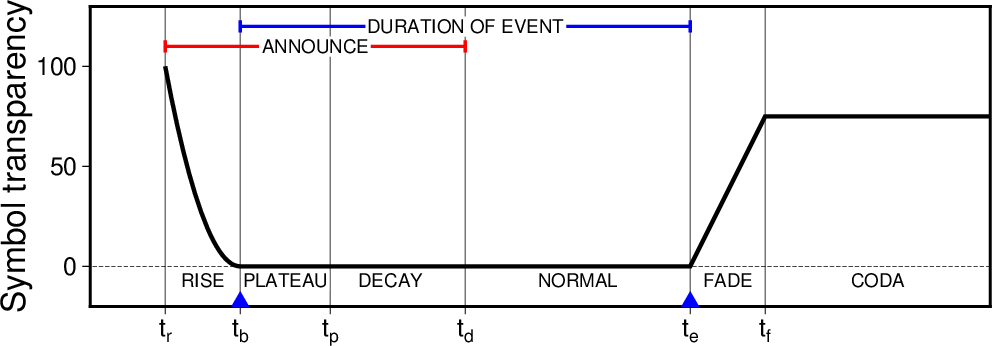
Here we show how a symbol may go from being invisible to reaching full opaqueness at the event begin time, finally fading to a near-invisible stage after reaching its length.
Finally, instead of selecting a fixed color for a symbol you can use -C to set a color table that we will use to modulate the color of the symbol. It is done by adding a variable fraction of dz to the data’s z-column and hence the CPT lookup will return different colors at different times. The amplitude is controlled with the -Mz option which will create dz values in the range 0-val1 [Default is 0-1]. In most cases the data set will have a zero z-value and hence the CPT will be set up for the 0-1 range (but note that the coda val2 value may be negative so compose your CPT accordingly if using coda). Figure below illustrates how dz may vary through time.
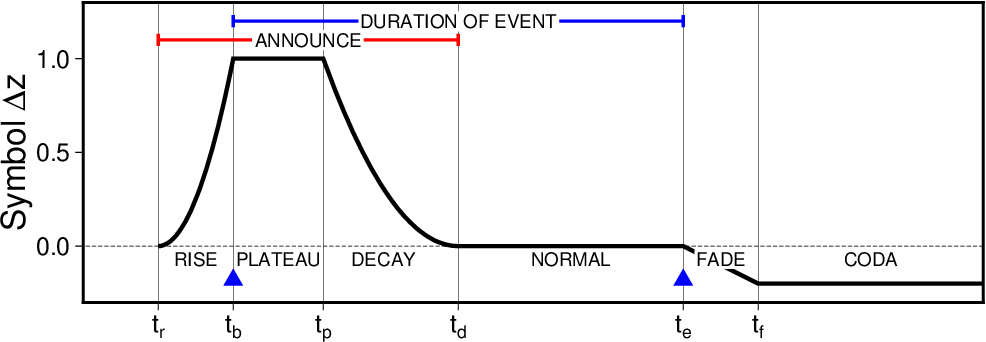
Here we show how a symbol may go from a constant color to changing colors at the event begin time, finally fading to a different-colored stage after reaching its length. This curve is scaled by the amplitude [1] and added to the z-data before CPT-lookup occurs.
While shown in these examples, the rise, plateau, fade, and coda periods are all optional and can be selected or ignored as you wish via -E. You can choose to specify any or none of the three time histories. By default the symbol size is constant, there is no intensity variation, and all symbols are opaque.
If trailing text is plotted (i.e., by selecting -Et) then only the transparency time-function is used and neither the plateau nor decay periods apply. The appearance and disappearance of a label is thus dictated by an initial (and optional) rise time (during which the label slowly becomes fully visible), an normal period (where it remains visible), followed by the optional fade period (where the text fades out). The figure below illustrate the setup:
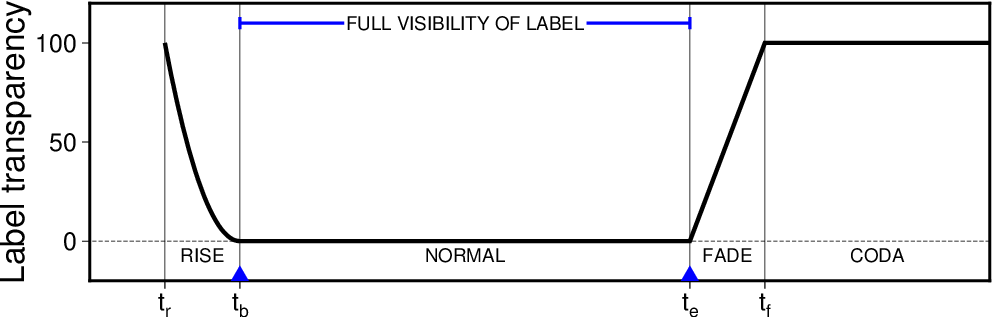
Here we show how a label may go from being invisible to reaching full opaqueness at the event begin time, staying visible for the given duration, and then finally fade away completely. For labels, the plateau and decay periods do not apply.
Sorting the data
While only the events that should be visible will be plotted at the given time set via -T, the order of plotting is simply given by the order of records in the file. Thus, if the file is not sorted into ascending time then later events might plot beneath earlier events. To prevent this, you can sort your file into ascending order via the gmtconvert -N option.
Drawing trajectories
If -Ar is used to draw trajectories (lines with x,y,t coordinates) then, as stated, we will use a linear interpolation to find intermediate terminal points. For geographic data, and especially if your original point spacing is large, you may wish to first interpolate such trajectories along great circles via sample1d rather than subject large gaps to linear interpolation. Note: If -Ardpu is used to discretize the line, then be aware that the resampling is affected by the current spline interpolator, controlled by GMT_INTERPOLANT. To avoid any departures from straigh line segments you will need to select a linear interpolant.
Examples
To show the display of events visible for May 1, 2018 given the catalog of large (>5) magnitude earthquakes that year, using a 2-day rise time during which we boost symbol size by a factor of 5 and wash out the color, followed by a decay over 6 days and then a final shrinking to half size and darken the color, we may try:
gmt begin layer
  gmt convert "https://earthquake.usgs.gov/fdsnws/event/1/query.csv?starttime=2018-01-01%2000:00:00&endtime=2018-12-31%2000:00:00&minmagnitude=5&orderby=time-asc" \
     -i2,1,3,4+s50,0 -hi1 > q.txt
  gmt makecpt -Cred,green,blue -T0,70,300,10000
  gmt events -Rg -JG200/5/6i -Baf q.txt -SE- -C --TIME_UNIT=d -T2018-05-01T -Es+r2+d6 -Ms5+c0.5 -Mi1+c-0.6 -Mt+c0
gmt end show
To convert the time-series seismic_trace.txt (time, amplitude) into a (time, amplitude, time) file that events can plot with a variable pen (by plotting densely placed circles), we use -i to ensure we read the time-column twice and then use a dpu of 80 pixels per cm (HD movie) and the projection parameters we will use when making the plot, e.g.,:
gmt events seismic_trace.txt -R1984-09-10T03:15/1984-09-10T03:45/-15/15 -JX20cT/10c -Ar80c -i0,1,0 > seismic_trace_pts.txt
Note: If your PROJ_LENGTH_UNIT is set to inch then you need to use the equivalent dpu of 200 pixels per inch for HD, or you specify -Ar200i.