(32) Draping an image over topography
In some cases, it is nice to “drape” an arbitrary image over a topographic map. We have already seen how to use psimage to plot an image anywhere in out plot. But here are aim is different, we want to manipulate an image to shade it and plot it in 3-D over topography. This example was originally created by Stephan Eickschen for a flyer emphasizing the historical economical and cultural bond between Brussels, Maastricht and Bonn. Obviously, the flag of the European Union came to mind as a good “background”.
To avoid adding large files to this example, some steps have been already done. First we get the EU flag directly from the web and convert it to a grid with values ranging from 0 to 255, where the higher values will become yellow and the lower values blue. This use of grdconvert requires GDAL support. grdedit then adds the right grid dimension.
The second step is to reformat the GTOPO30 DEM file to a netCDF grid as well and then subsample it at the same pixels as the EU flag. We then illuminate the topography grid so we can use it later to emphasize the topography. The colors that we will use are those of the proper flag. Lower values will become blue and the upper values yellow.
The call the grdview plots a topography map of northwest continental Europe, with the flagged draped over it and with shading to show the little topography there is. pscoast is used in conjunction with grdtrack and psxyz to plot borders “at altitude”. Something similar is done at the end to plot some symbols and names for cities.
The script produces the plot in the Figure fig_ex32. Note that the PNG image of the flag can be downloaded directly in the call the grdconvert, but we have commented that out in the example because it requires compilation with GDAL support. You will also see the grdcut command commented out because we did not want to store the 58 MB DEM file, whose location is mentioned in the script.
#!/bin/bash
#		GMT EXAMPLE 32
#		$Id$
#
# Purpose:	Illustrate draping of an image over topography
# GMT modules:	grdcut, grdedit, grdgradient, grdconvert, grdtrack, grdview
# GMT modules:	pscoast, pstext, psxyz
# Unix progs:	cat, rm
# Credits:	Original by Stephan Eickschen
#
ps=example_32.ps

# Here we get and convert the flag of Europe directly from the web through grdconvert using
# GDAL support. We take into account the dimension of the flag (1000x667 pixels)
# for a ratio of 3x2.
# Because GDAL support will not be standard for most users, we have stored
# the result, euflag.nc in this directory.

Rflag=-R3/9/50/54
# gmt grdconvert \
#   http://upload.wikimedia.org/wikipedia/commons/thumb/b/b7/Flag_of_Europe.svg/1000px-Flag_of_Europe.svg.png=gd \
#   euflag.nc=ns
# gmt grdedit euflag.nc -fg $Rflag

# Now get the topography for the same area from GTOPO30 and store it as topo.nc.
# The DEM file comes from http://eros.usgs.gov/#/Find_Data/Products_and_Data_Available/gtopo30/w020n90
# We make a gradient grid as well, which we will use to "illuminate" the flag.

# gmt grdcut W020N90.DEM $Rflag -Gtopo.nc=ns

# The color map assigns "Reflex Blue" to the lower half of the 0-255 range and
# "Yellow" to the upper half.
gmt makecpt -C0/51/153,255/204/0 -T0,127,255 -N > euflag.cpt

# The next step is the plotting of the image.
# We use gmt grdview to plot the topography, euflag.nc to give the color, and illum.nc to give
# the shading.

Rplot=$Rflag/-10/790
gmt grdview topo.nc -JM13c $Rplot -Ceuflag.cpt -Geuflag.nc -I+a0/270+ne0.6 -Qc -JZ1c -p157.5/30 -P -K > $ps

# We now add borders. Because we have a 3-D plot, we want them to be plotted "at elevation".
# So we write out the borders, pipe them through grdtrack and then plot them with psxyz.

gmt pscoast $Rflag -Df -M -N1 | gmt grdtrack -Gtopo.nc -sa | gmt psxyz $Rplot -J -JZ -p -W1p,white \
	-O -K >> $ps

# Finally, we add dots and names for three cities.
# Again, gmt grdtrack is used to put the dots "at elevation".

cat << EOF > cities.txt
05:41:27 50:51:05 Maastricht
04:21:00 50:51:00 Bruxelles
07:07:03 50:43:09 Bonn
EOF

gmt grdtrack -Gtopo.nc cities.txt | gmt psxyz -i0,1,3 $Rplot -J -JZ -p -Sc7p -W1p,white -Gred \
	-K -O >> $ps
gmt pstext $Rplot -J -JZ -p -F+f12p,Helvetica-Bold,red+jRM -Dj0.1i/0 -O cities.txt >> $ps

# cleanup

rm -f gmt.conf euflag.cpt cities.txt
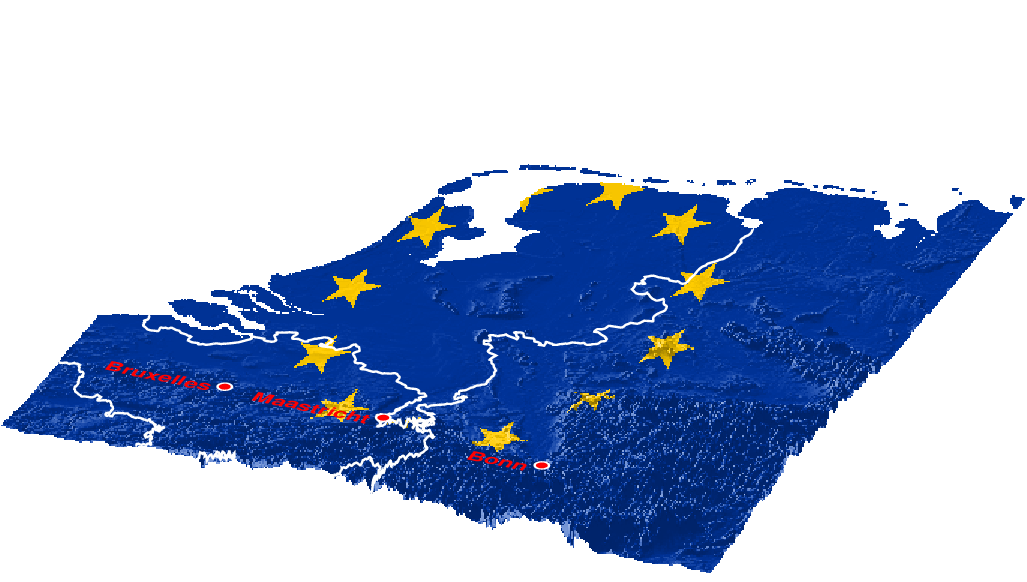
Draping an image over topography