(30) Trigonometric functions plotted in graph mode
Finally, we end with a simple mathematical illustration of sine and cosine, highlighting the graph mode for linear projections and the new curved vectors for angles.
The script simply draws a graph basemap, computes sine and cosine and plots them as lines, then indicates on a circle that these quantities are simply the projections of an unit vector on the x- and y-axis, at the given angle.
#!/bin/bash
#		GMT EXAMPLE 30
#		$Id$
#
# Purpose:	Show graph mode and math angles
# GMT modules:	gmtmath, psbasemap, pstext and psxy
# Unix progs:	echo, rm
#
# Draw generic x-y axes with arrows
ps=example_30.ps

gmt psbasemap -R0/360/-1.25/1.75 -JX8i/6i -Bx90f30+u"\\312" -By1g10 -BWS+t"Two Trigonometric Functions" \
	-K --MAP_FRAME_TYPE=graph --MAP_VECTOR_SHAPE=0.5 > $ps

# Draw sine an cosine curves

gmt math -T0/360/0.1 T COSD = | gmt psxy -R -J -O -K -W3p >> $ps
gmt math -T0/360/0.1 T SIND = | gmt psxy -R -J -O -K -W3p,0_6:0 --PS_LINE_CAP=round >> $ps

# Indicate the x-angle = 120 degrees
gmt psxy -R -J -O -K -W0.5p,- << EOF >> $ps
120	-1.25
120	1.25
EOF

gmt pstext -R -J -O -K -Dj0.2c -N -F+f+j << EOF >> $ps
360 1 18p,Times-Roman RB x = cos(@%12%a@%%)
360 0 18p,Times-Roman RB y = sin(@%12%a@%%)
120 -1.25 14p,Times-Roman LB 120\\312
370 -1.35 24p,Symbol LT a
-5 1.85 24p,Times-Roman RT x,y
EOF

# Draw a circle and indicate the 0-70 degree angle

echo 0 0 | gmt psxy -R-1/1/-1/1 -Jx1.5i -O -K -X3.625i -Y2.75i -Sc2i -W1p -N >> $ps
gmt psxy -R -J -O -K -W1p << EOF >> $ps
> x-gridline  -Wdefault
-1	0
1	0
> y-gridline  -Wdefault
0	-1
0	1
> angle = 0
0	0
1	0
> angle = 120
0	0
-0.5	0.866025
> x-gmt projection -W2p
-0.3333	0
0	0
> y-gmt projection -W2p
-0.3333	0.57735
-0.3333	0
EOF

gmt pstext -R -J -O -K -Dj0.05i -F+f+a+j << EOF >> $ps
-0.16666 0 12p,Times-Roman 0 CT x
-0.3333 0.2888675 12p,Times-Roman 0 RM y
0.22 0.27 12p,Symbol -30 CB a
-0.33333 0.6 12p,Times-Roman 30 LB 120\\312
EOF

echo 0 0 0.5i 0 120 | gmt psxy -R -J -O -Sm0.15i+e -W1p -Gblack >> $ps
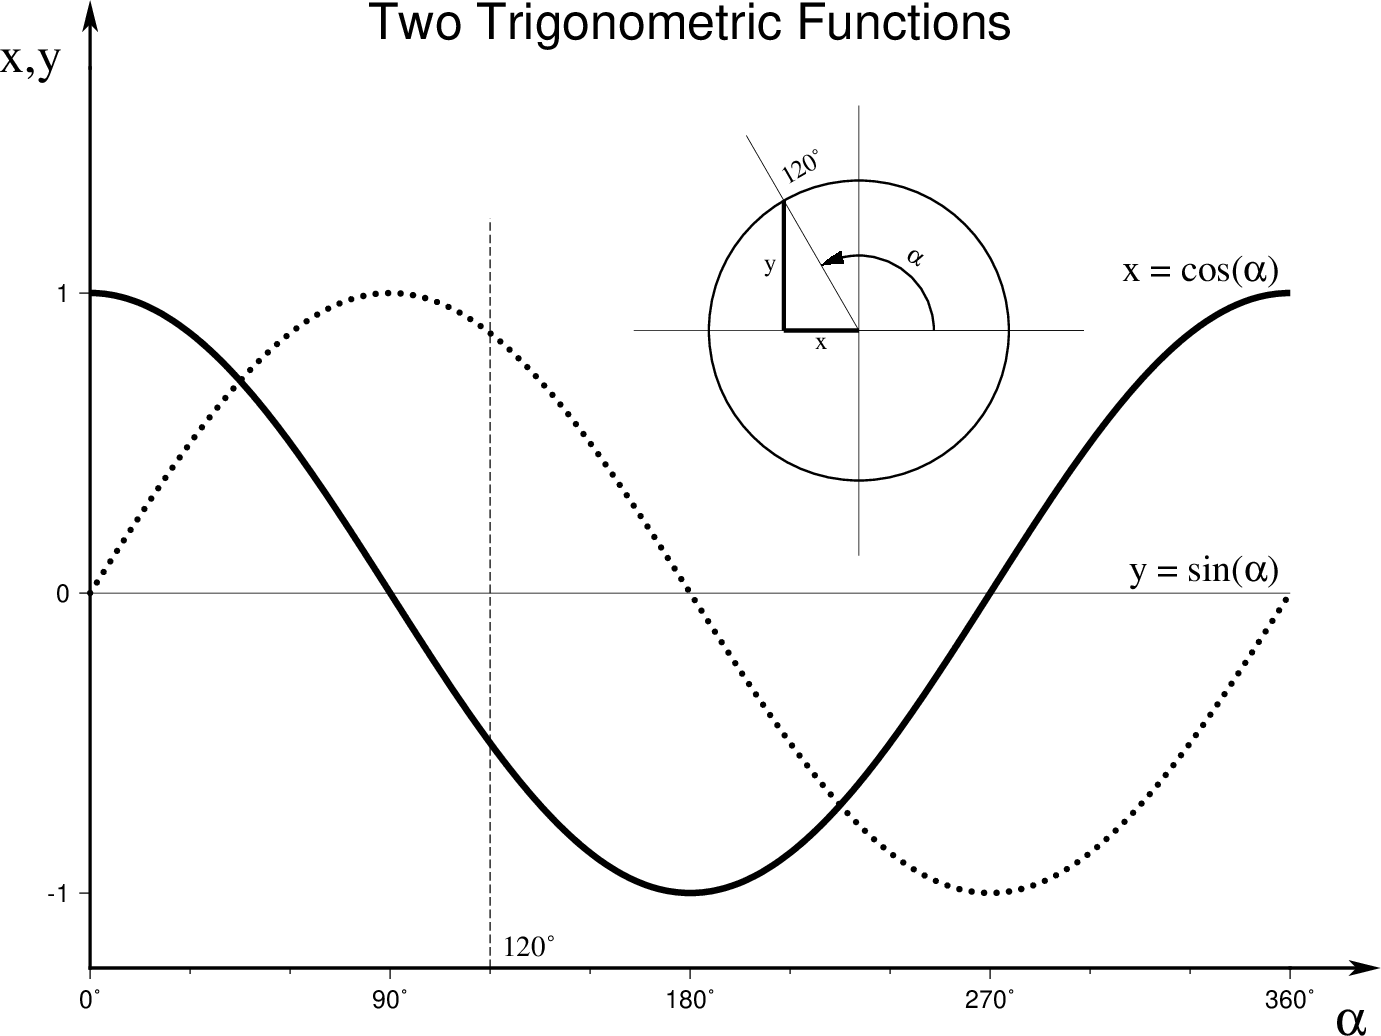
Trigonometric functions plotted in graph mode.