(17) Images clipped by coastlines
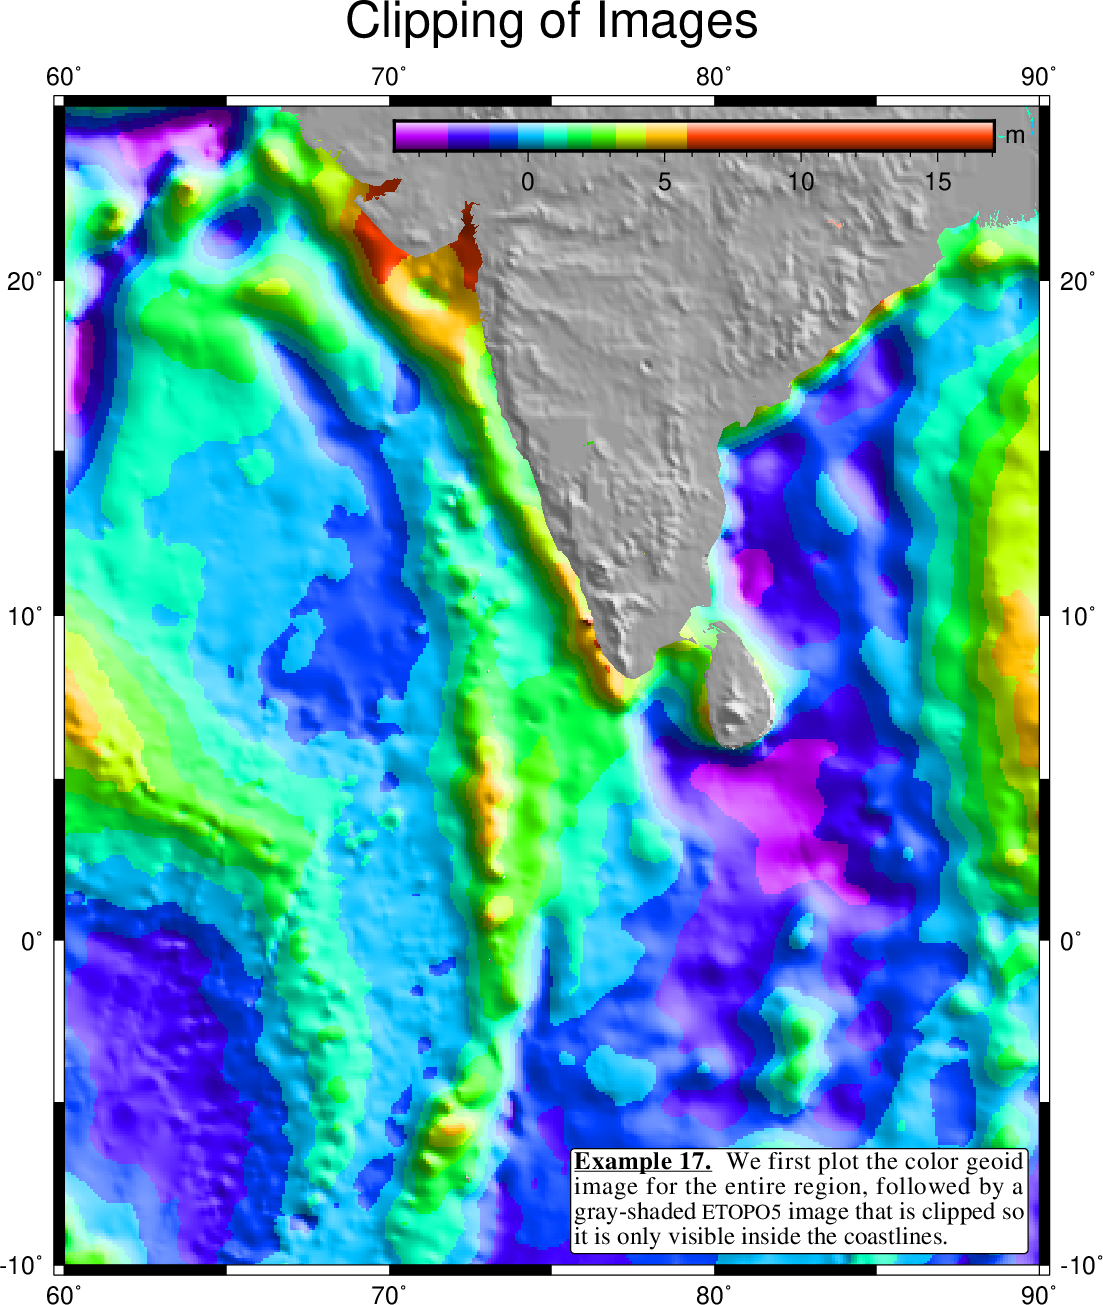
This example demonstrates how pscoast can be used to set up clip paths based on coastlines. This approach is well suited when different gridded data sets are to be merged on a plot using different CPTs. Merging the files themselves may not be doable since they may represent different data sets, as we show in this example. Here, we lay down a color map of the geoid field near India with grdimage, use pscoast to set up land clip paths, and then overlay topography from the ETOPO5 data set with another call to grdimage. We finally undo the clippath with a second call to pscoast with the option -Q (See the Figure Clipping of images using coastlines):
We also plot a color legend on top of the land. So here we basically have three layers of “paint” stacked on top of each other: the underlaying geoid map, the land mask, and finally the color legend. This legend makes clear how grd2cpt distributed the colors over the range: they are not of equal length put are associated with equal amounts of area in the plot. Since the high amounts (in red) are not very prevalent, that color spans a long range.
For this image it is appropriate to use the -I option in psscale so the legend gets shaded, similar to the geoid grid. See Appendix [app:M] to learn more about CPTs and ways to draw color legends.
#!/bin/bash
#		GMT EXAMPLE 17
#		$Id$
#
# Purpose:	Illustrates clipping of images using coastlines
# GMT modules:	grd2cpt, grdimage, pscoast, pstext
# Unix progs:	rm
#
ps=example_17.ps

# First generate geoid image w/ shading

gmt grd2cpt india_geoid.nc -Crainbow > geoid.cpt
gmt grdimage india_geoid.nc -I+a45+nt1 -JM6.5i -Cgeoid.cpt -P -K > $ps

# Then use gmt pscoast to initiate clip path for land

gmt pscoast -Rindia_geoid.nc -J -O -K -Dl -Gc >> $ps

# Now generate topography image w/shading

gmt makecpt -C150 -T-10000,10000 -N > shade.cpt
gmt grdimage india_topo.nc -I+a45+nt1 -J -Cshade.cpt -O -K >> $ps

# Finally undo clipping and overlay basemap

gmt pscoast -R -J -O -K -Q -B10f5 -B+t"Clipping of Images" >> $ps

# Put a color legend on top of the land mask

gmt psscale -DjTR+o0.3i/0.1i+w4i/0.2i+h -R -J -Cgeoid.cpt -Bx5f1 -By+lm -I -O -K >> $ps

# Add a text paragraph

gmt pstext -R -J -O -M -Gwhite -Wthinner -TO -D-0.1i/0.1i -F+f12,Times-Roman+jRB >> $ps << END
> 90 -10 12p 3i j
@_@%5%Example 17.@%%@_  We first plot the color geoid image
for the entire region, followed by a gray-shaded @#etopo5@#
image that is clipped so it is only visible inside the coastlines.
END

# Clean up

rm -f geoid.cpt shade.cpt
Clipping of images using coastlines