(1) Contour maps
We want to create two contour maps of the low order geoid using the
Hammer equal area projection. Our gridded data file is called osu91a1f_16.nc and
contains a global 1 by 1 gridded geoid (we will see how to make gridded
files later). We would like to show one map centered on Greenwich and
one centered on the dateline. Positive contours should be drawn with a
solid pen and negative contours with a dashed pen. Annotations should
occur for every 50 m contour level, and both contour maps should show
the continents in light brown in the background. Finally, we want a
rectangular frame surrounding the two maps. This is how it is done:
#!/bin/bash
#		GMT EXAMPLE 01
#		$Id$
#
# Purpose:	Make two contour maps based on the data in the file osu91a1f_16.nc
# GMT modules:	gmtset, grdcontour, psbasemap, pscoast
# Unix progs:	rm
#
ps=example_01.ps
gmt set MAP_GRID_CROSS_SIZE_PRIMARY 0 FONT_ANNOT_PRIMARY 10p
gmt psbasemap -R0/6.5/0/7.5 -Jx1i -B0 -P -K > $ps
gmt pscoast -Rg -JH0/6i -X0.25i -Y0.2i -O -K -Bg30 -Dc -Glightbrown -Slightblue >> $ps
gmt grdcontour osu91a1f_16.nc -J -C10 -A50+f7p -Gd4i -L-1000/-1 -Wcthinnest,- -Wathin,- \
            -O -K -T+d0.1i/0.02i >> $ps
gmt grdcontour osu91a1f_16.nc -J -C10 -A50+f7p -Gd4i -L-1/1000 -O -K -T+d0.1i/0.02i >> $ps
gmt pscoast -Rg -JH6i -Y3.4i -O -K -B+t"Low Order Geoid" -Bg30 -Dc -Glightbrown \
            -Slightblue >> $ps
gmt grdcontour osu91a1f_16.nc -J -C10 -A50+f7p -Gd4i -L-1000/-1 -Wcthinnest,- -Wathin,- \
            -O -K -T+d0.1i/0.02i+l >> $ps
gmt grdcontour osu91a1f_16.nc -J -C10 -A50+f7p -Gd4i -L-1/1000 -O -T+d0.1i/0.02i+l >> $ps
rm -f gmt.conf
The first command draws a box surrounding the maps. This is followed by two sequences of pscoast, grdcontour, grdcontour. They differ in that the first is centered on Greenwich; the second on the dateline. We use the limit option (-L) in grdcontour to select negative contours only and plot those with a dashed pen, then positive contours only and draw with a solid pen [Default]. The -T option causes tick marks pointing in the downhill direction to be drawn on the innermost, closed contours. For the upper panel we also added - and + to the local lows and highs. You can find this illustration as
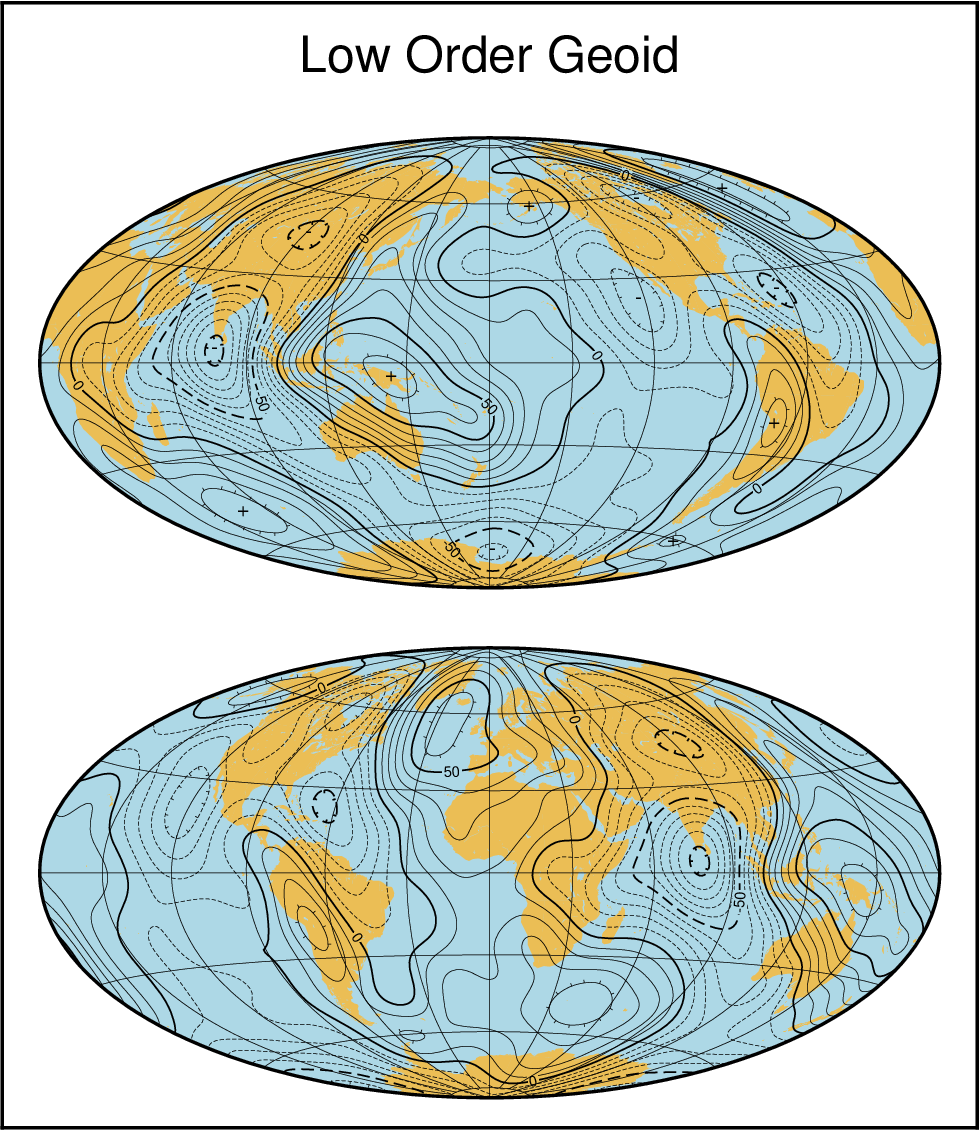
Contour maps of gridded data.