(28) Mixing UTM and geographic data sets
Next, we present a similar case: We wish to plot a data set given in UTM coordinates (meter) and want it to be properly registered with overlying geographic data, such as coastlines or data points. The mistake many GMT rookies make is to specify the UTM projection with their UTM data. However, that data have already been projected and is now in linear meters. The only sensible way to plot such data is with a linear projection, yielding a UTM map. In this step one can choose to annotate or tick the map in UTM meters as well. To plot geographic (lon/lat) data on the same map you simply have to specify the region using the UTM meters but supply the actual UTM projection parameters. Make sure you use the same scale with both the linear and UTM projection.
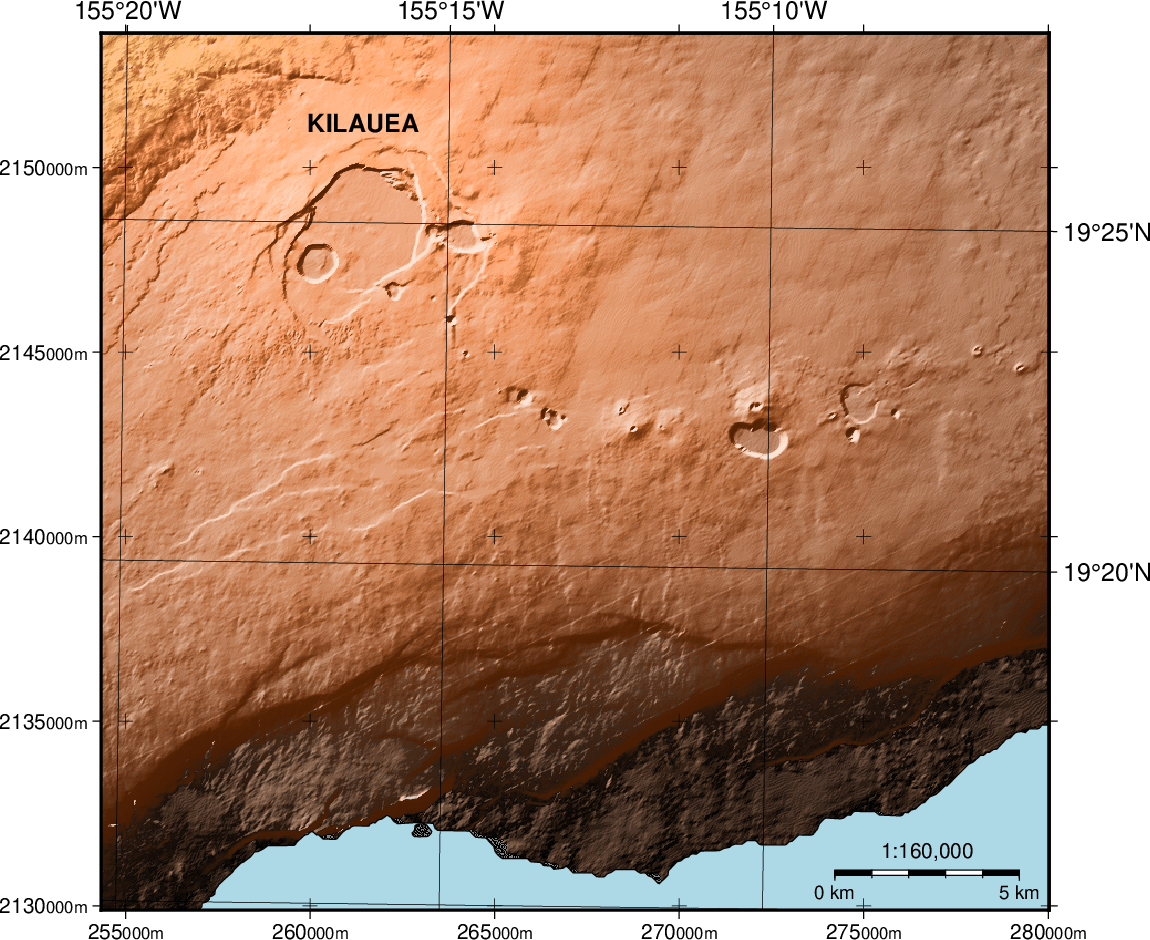
Our script illustrates how we would plot a remote UTM grid (with coordinates in meters) of elevations near Kilauea volcano on the Big Island of Hawaii and overlay geographical information (with longitude, latitude coordinates). We first lay down the UTM grid using the linear projection. Then, given we are in UTM zone 5Q, we use the UTM domain and the UTM projection when overlaying the coastline and light blue ocean. We do some trickery by converting the UTM domain to km so that we can add custom annotations to the map. Finally, we place a scale bar and label Kilauea crater to complete the figure.
#!/usr/bin/env bash
#		GMT EXAMPLE 28
#
# Purpose:	Illustrates how to mix UTM data and UTM gmt projection
# GMT modules:	makecpt, grdimage, coast, text, basemap
# Unix progs:	echo
#
gmt begin ex28
	# Set up a color table
	gmt makecpt -Ccopper -T0/1500
	# Lay down the UTM topo grid using a 1:160,000 scale
	gmt grdimage @Kilauea.utm.nc -I+d -Jx1:160000 --FONT_ANNOT_PRIMARY=9p
	# Overlay geographic data and coregister by using correct region and gmt projection with the same scale
	gmt coast -R@Kilauea.utm.nc -Ju5Q/1:160000 -Df+ -Slightblue -W0.5p -B5mg5m -BNE \
		--FONT_ANNOT_PRIMARY=12p --FORMAT_GEO_MAP=ddd:mmF
	echo 155:16:20W 19:26:20N KILAUEA | gmt text -F+f12p,Helvetica-Bold+jCB
	gmt basemap --FONT_ANNOT_PRIMARY=9p -LjRB+c19:23N+f+w5k+l1:160,000+u+o0.5c --FONT_LABEL=10p
	# Annotate in km but append ,000m to annotations to get customized meter labels
	gmt basemap -R@Kilauea.utm.nc+Uk -Jx1:160 -B5g5+u"@:8:000m@::" -BWSne --FONT_ANNOT_PRIMARY=10p \
		--MAP_GRID_CROSS_SIZE_PRIMARY=0.25c --FONT_LABEL=10p
gmt end show
Mixing UTM and geographic data sets requires consistent use of the same map scale.