(11) A 3-D RGB color cube
In this example we generate a series of 6 color images, arranged so that they can be cut out and assembled into a 3-D color cube. The six faces of the cube represent the outside of the R-G-B color space. On each face one of the color components is fixed at either 0 or 255 and the other two components vary smoothly across the face from 0 to 255. The cube is configured as a right-handed coordinate system with x-y-z mapping R-G-B. Hence, the 8 corners of the cube represent the primaries red, green, and blue, plus the secondaries cyan, magenta and yellow, plus black and white.
The 6 color faces are generated by feeding grdimage three grids, one for each color component (R, G, and B). In some cases the X or Y axes of a face are reversed by specifying a negative width or height in order to change the variation of the color value in that direction from ascending to descending, or vice versa.
A number of rays emanating from the white and black corners indicate the Hue value (ranging from 0 to 360). The dashed and dotted lines near the white corner reflect saturation levels, running from 0 to 1 (in black font). On these 3 faces the brightness is a constant value of 1. On the other 3 faces of the cube, around the black corner, the white decimal numbers indicate brightnesses between 0 and 1, with saturation fixed at 1.
#!/usr/bin/env bash
#		GMT EXAMPLE 11
#
# Purpose:	Create a 3-D RGB Cube
# GMT modules:	set, grdimage, grdmath, text, plot
# Unix progs:	echo, rm
gmt begin ex11
# Use gmt plot to plot "cut-along-the-dotted" lines.
	gmt set MAP_TICK_LENGTH_PRIMARY 0

	# First, create grids of ascending X and Y and constant 0.
	# These are to be used to represent R, G and B values of the darker 3 faces of the cube.
	gmt grdmath -I1 -R0/255/0/255 X = x1.nc
	gmt grdmath Y = y1.nc
	gmt grdmath 0 = c1.nc

	# Second, create grids of descending X and Y and constant 255.
	# These are to be used to represent R, G and B values of the lighter 3 faces of the cube.
	gmt grdmath 255 X SUB = x2.nc
	gmt grdmath 255 Y SUB = y2.nc
	gmt grdmath 255       = c2.nc

	gmt plot @cut-here_11.txt -Wthinnest,. -R-51/306/0/1071 -JX8.4c/25.2c -X6c

	gmt set FONT_ANNOT_PRIMARY 12p,Helvetica-Bold

	gmt grdimage x1.nc y1.nc c1.nc -JX6c/-6c -R0/255/0/255 -X1.25c
	gmt plot -Wthinner,white,- @rays_11.txt
	gmt text --FONT=white -F+a+f <<- END
	128 128 -45 12p 60@.
	102  26 -90 12p 0.4
	204  26 -90 12p 0.8
	10  140 180 16p G
	END
	echo 0 0 0 128 | gmt plot -N -Sv0.4c+s+e -Gwhite -W2p,white

	gmt grdimage x1.nc c1.nc y1.nc -JX6c/6c -Y6c
	gmt plot -Wthinner,white,- @rays_11.txt
	gmt text --FONT=white -F+a+f <<- END
	128 128  45 12p 300@.
	26  102   0 12p 0.4
	26  204   0 12p 0.8
	140  10 -90 16p R
	100 100 -45 16p V
	END
	echo 0 0 128 0 | gmt plot -N -Sv0.4c+s+e -Gwhite -W2p,white
	echo 0 0 90 90 | gmt plot -N -Sv0.4c+s+e -Gwhite -W2p,white

	gmt grdimage c1.nc x1.nc y1.nc -JX-6c/6c -X-6c
	gmt plot -Wthinner,white,- @rays_11.txt
	gmt text --FONT=white -F+a+f <<- END
	128 128 135 12p 180@.
	102  26  90 12p 0.4
	204  26  90 12p 0.8
	10  140   0 16p B
	END
	echo 0 0 0 128 | gmt plot -N -Sv0.4c+s+e -Gwhite -W2p,white
	echo 0 0 128 0 | gmt plot -N -Sv0.4c+s+e -Gwhite -W2p,white

	gmt grdimage x2.nc y2.nc c2.nc -JX-6c/-6c -X6c -Y6c
	gmt plot -Wthinner,black,- @rays_11.txt
	gmt text -F+a+f <<- END
	128 128 225 12p 240@.
	102  26 270 12p 0.4
	204  26 270 12p 0.8
	END

	gmt grdimage c2.nc y2.nc x2.nc -JX6c/-6c -X6c
	gmt plot -Wthinner,black,- @rays_11.txt
	gmt text -F+a+f <<- END
	128 128 -45 12p 0@.
	26  102   0 12p 0.4
	26  204   0 12p 0.8
	100 100  45 16p S
	204  66  90 16p H
	END
	echo 0 0 90 90 | gmt plot -N -Sv0.4c+s+e -Gblack -W2p
	echo 204 204 204 76 | gmt plot -N -Sv0.4c+s+e -Gblack -W2p

	gmt grdimage x2.nc c2.nc y2.nc -JX-6c/6c -X-6c -Y6c
	gmt plot -Wthinner,black,- @rays_11.txt
	gmt text -F+a+f <<- END
	128 128 135 12p 120@.
	26  102 180 12p 0.4
	26  204 180 12p 0.8
	200 200 225 16p GMT
	END

	rm -f *.nc
gmt end show
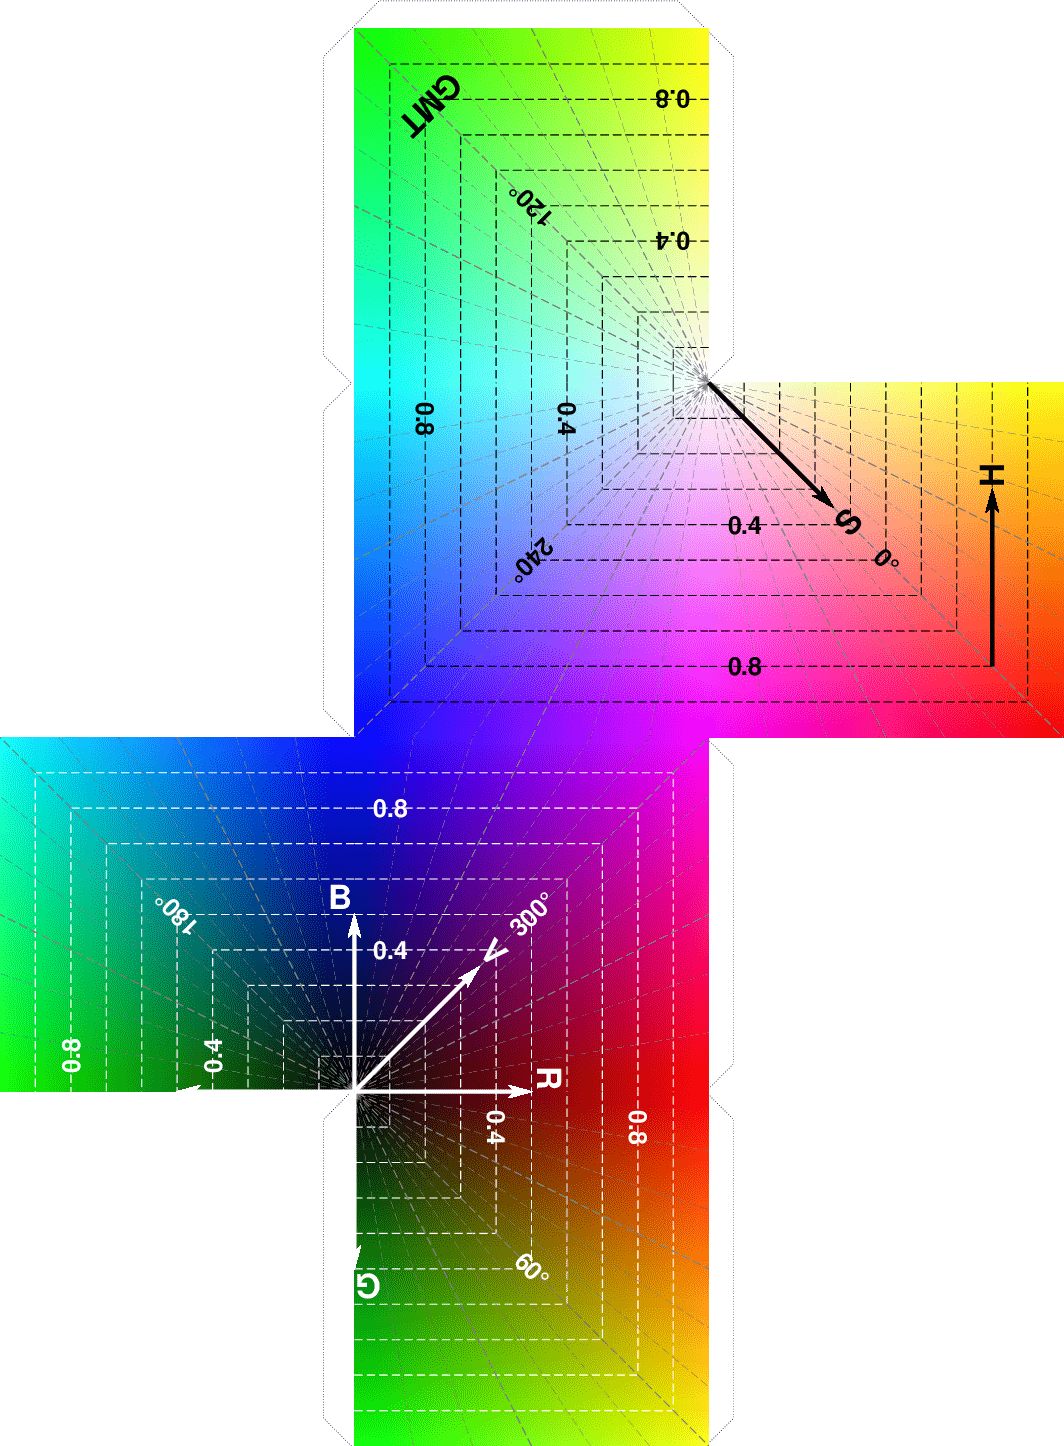
The RGB color cube